

Answered step by step
Verified Expert Solution
Question
1 Approved Answer
K Part 4 of 18 100 points Points: 0.5 of 5 Bus Save 2 1064 39 3 997 0 41 Using the accompanying Concert
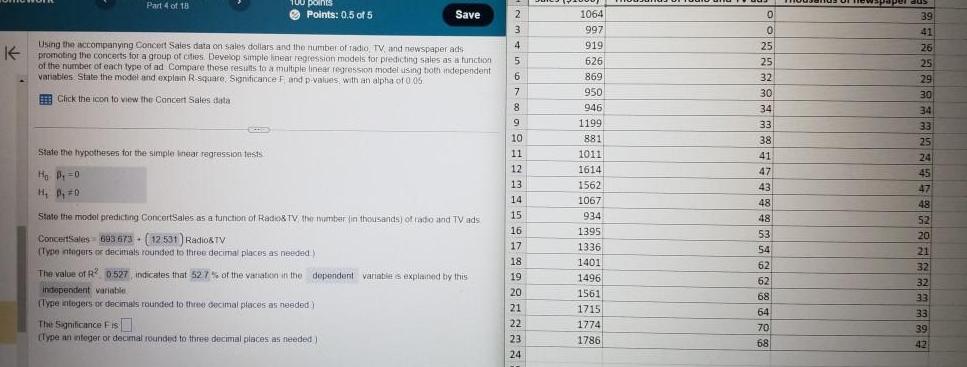
K Part 4 of 18 100 points Points: 0.5 of 5 Bus Save 2 1064 39 3 997 0 41 Using the accompanying Concert Sales data on sales dollars and the number of radio, TV, and newspaper ads promoting the concerts for a group of cities. Develop simple linear regression models for predicting sales as a function of the number of each type of ad Compare these results to a multiple linear regression model using both independent variables. State the model and explain R-square, Significance F and p-values, with an alpha of 0.05 Click the icon to view the Concert Sales data 4 919 25 26 5 626 25 25 6 869 32 29 7 950 30 30 8 946 34 34 9 1199 33 33 10 881 38 25 State the hypotheses for the simple linear regression tests 11 1011 41 24 12 1614 Ho P=0 47 45 13 1562 43 47 H P, #0 14 1067 48 48 State the model predicting ConcertSales as a function of Radio& TV the number (in thousands) of radio and TV ads 15 934 48 52 16 1395 53 20 ConcertSales 603 673 (12531) Radio&TV + 17 1336 54 21 (Type integers or decimals rounded to three decimal places as needed) 18 1401 62 32 The value of R2 0.527, indicates that 527 % of the variation in the dependent variable is explained by this independent variable 19 1496 62 32 20 1561 68 33 (Type integers or decimals rounded to three decimal places as needed) 21 1715 64 33 The Significance Fis 22 1774 70 39 (Type an integer or decimal rounded to three decimal places as needed) 23 1786 68 42 24
Step by Step Solution
There are 3 Steps involved in it
Step: 1

Get Instant Access to Expert-Tailored Solutions
See step-by-step solutions with expert insights and AI powered tools for academic success
Step: 2

Step: 3
Ace Your Homework with AI
Get the answers you need in no time with our AI-driven, step-by-step assistance
Get Started
Quantitative Methods For Business Management And Finance
Authors: Louise Swift, Sally Piff
2nd Edition
1403935289, 9781403935281