

Answered step by step
Verified Expert Solution
Question
1 Approved Answer
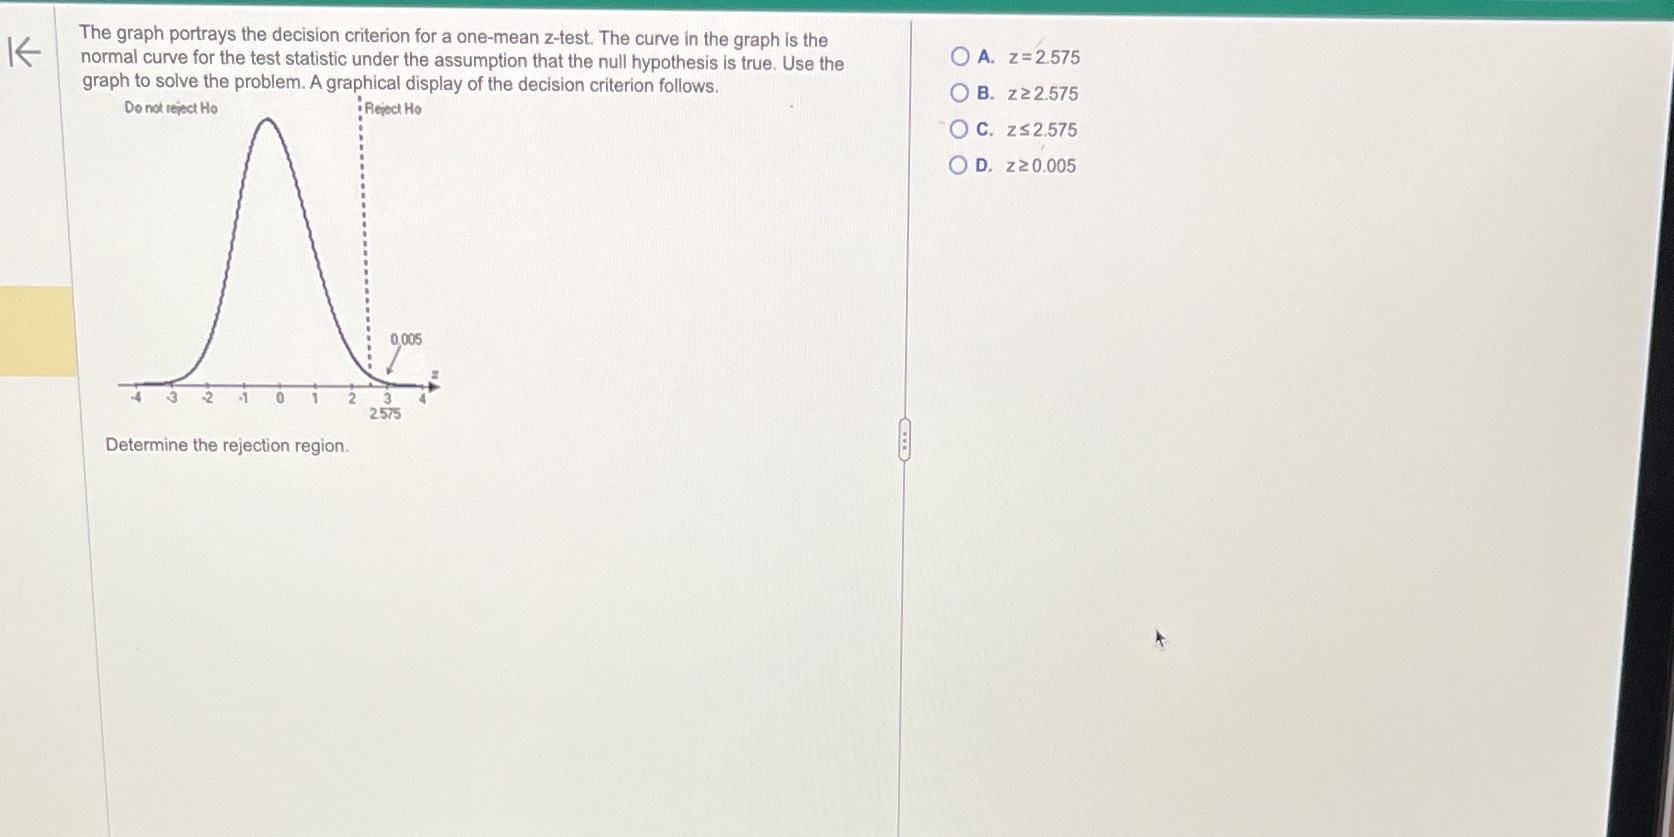
K The graph portrays the decision criterion for a one-mean z-test. The curve in the graph is the normal curve for the test statistic under

Step by Step Solution
There are 3 Steps involved in it
Step: 1

Get Instant Access to Expert-Tailored Solutions
See step-by-step solutions with expert insights and AI powered tools for academic success
Step: 2

Step: 3
Ace Your Homework with AI
Get the answers you need in no time with our AI-driven, step-by-step assistance
Get Started
Sample Size Determination In Clinical Trials With Multiple Endpoints
Authors: Takashi Sozu, Tomoyuki Sugimoto, Toshimitsu Hamasaki, Scott R Evans
1st Edition
3319220055, 9783319220055