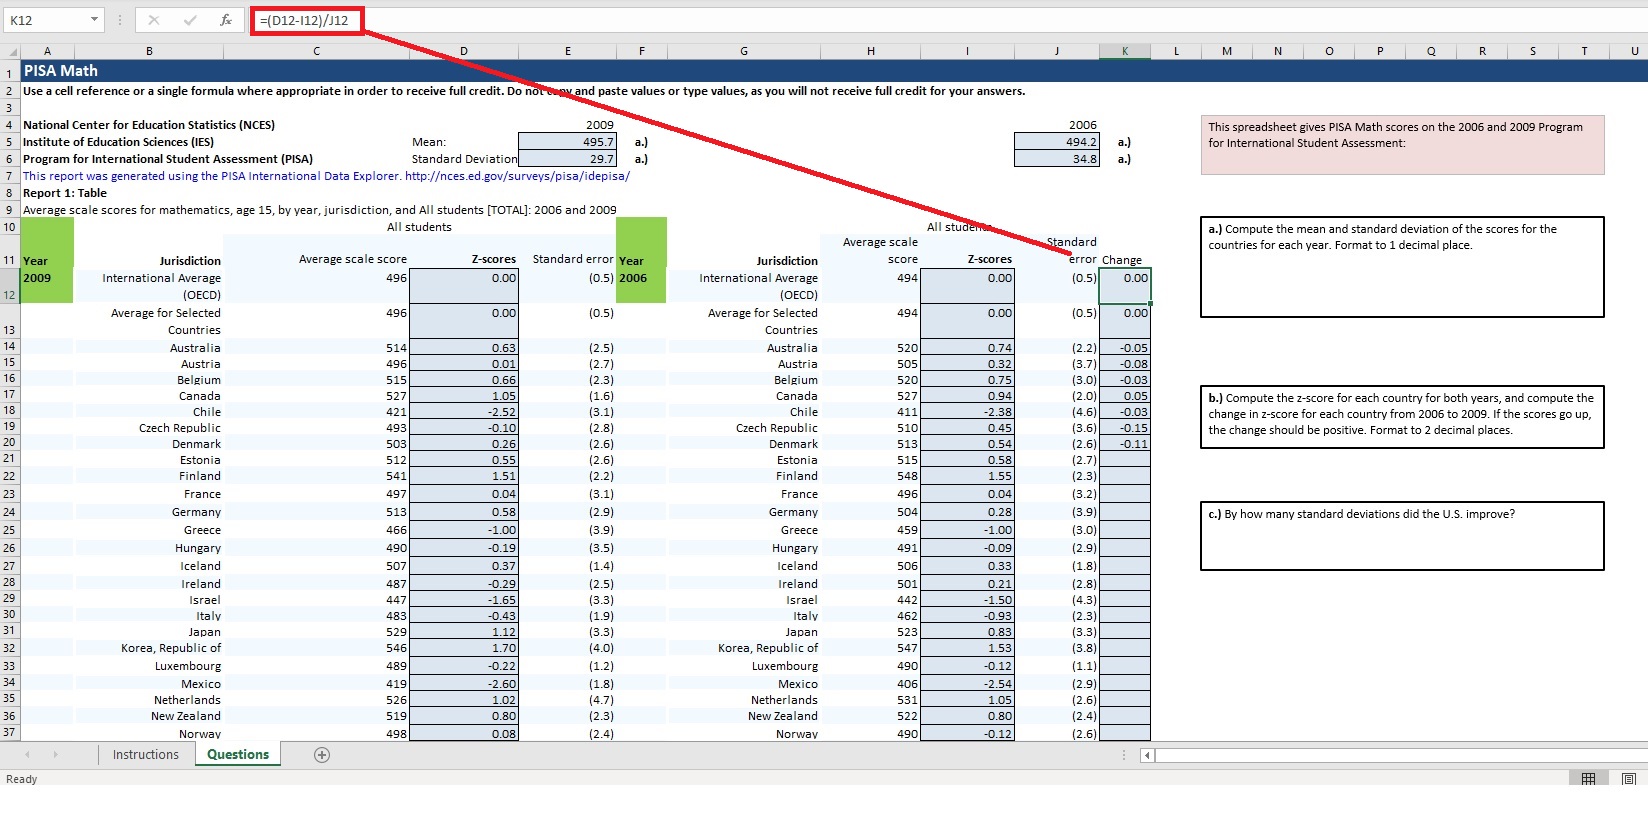
K12 X V =(D12-112)/J12 D G H M N P Q R S U B PISA Math 2 Use a cell reference or a single formula where appropriate in order to receive full credit. Do not wwww and paste values or type values, as you will not receive full credit for your answers. 4 National Center for Education Statistics (NCES) 2009 2006 This spreadsheet gives PISA Math scores on the 2006 and 2009 Program 5 Institute of Education Sciences (IES) Mean: 495.7 a.) 494.2 a.) for International Student Assessment: a . ) 6 Program for International Student Assessment (PISA) Standard Deviation 29.7 34.8 7 This report was generated using the PISA International Data Explorer. http:/ces.ed.gov/surveys/pisa/idepisa/ 8 Report 1: Table 9 Average scale scores for mathematics, age 15, by year, jurisdiction, and All students [TOTAL]: 2006 and 2009 10 All students All studer a.) Compute the mean and standard deviation of the scores for the Average scale Standard countries for each year. Format to 1 decimal place. 11 Year Jurisdiction Average scale score Z-scores Standard error Year Jurisdiction score Z-scores error Change International Average 496 0.00 (0.5) 2006 International Average 494 0.00 (0.5) 0.00 2009 12 (OECD) (OECD) Average for Selected 496 0.00 (0.5) Average for Selected 494 0.00 10.5 0.00 13 Countries Countries 14 Australia 514 0.63 (2.5) Australia 520 0.74 (2.2) -0.05 Austria 496 0.01 (2.7) Austria 505 0.32 (3.7) -0.08 Belgium 515 0.66 (2.3) Belgium 520 0.75 (3.0) -0.03 Canada 527 1.05 (1.6) Canada 527 0.94 (2.0) 0.05 b.) Compute the z-score for each country for both years, and compute the 18 Chile 421 -2.52 (3.1 Chile 411 -2.38 (4.6) -0.03 change in z-score for each country from 2006 to 2009. If the scores go up, Czech Republic 493 -0.10 (2.8) Czech Republic 510 0.45 (3.6) -0.15 the change should be positive. Format to 2 decimal places Denmark 503 0.26 (2.6) Denmark 513 0.54 (2.6) -0.11 Estonia 512 0.55 (2.6) Estonia 515 0.58 (2.7 ) Finland 541 1.51 (2.2) Finland 548 1.55 (2.3 ) France 497 0.04 (3.1) France 496 0.04 (3.2) Germany 513 0.58 (2.9) Germany 504 0.28 (3.9 ) c.) By how many standard deviations did the U.S. improve? Greece 466 -1.00 (3.9 Greece 459 -1.00 (3.0) Hungary 490 0.19 (3.5) Hungary 491 0.09 (2.9) Iceland 507 0.37 (1.4) Iceland 506 0.33 1.8 Ireland 487 0.29 (2.5) Ireland 501 0.21 (2.8 ) Israel 447 1.65 (3.3 Israel 442 1.50 ( 4.3 ) Italy 483 0.43 (1.9 Italy 462 0.93 ( 2.3 ) Japan 529 1.12 (3.3 Japan 523 0.83 (3.3 ) Korea, Republic of 546 1.70 (4.0) Korea, Republic of 547 1.53 (3.8) Luxembourg 489 -0.22 (1.2) Luxembourg 490 -0.12 (1.1) Mexico 419 2.60 (1.8) Mexico 406 -2.54 (2.9) Netherlands 526 1.02 (4.7) Netherlands 531 1.05 (2.6) New Zealand 519 0.80 (2.3) New Zealand 522 0.80 (2.4) Norway 498 0.08 (2.4) Norway 490 0.12 2.6) Instructions Questions + ReadyIreland 487 -0.29 (2.5) Ireland 501 0.21 (2.8 Israel 447 -1.65 (3.3) Israel 442 -1.50 (4.3) Italy 483 -0.43 (1.9) Italy 462 -0.93 (2.3) Japan 529 1.12 (3.3) Japan 523 0.83 (3.3 Korea, Republic of 546 1.70 (4.0) Korea, Republic of 547 1.53 (3.8) Luxembourg 489 0.22 (1.2) Luxembourg 490 -0.12 (1.1) Mexico 419 -2.60 (1.8) Mexico 406 2.54 (2.9 ) Netherlands 526 1.02 (4.7) Netherlands 531 1.05 (2.6 ) New Zealand 519 0.80 (2.3) New Zealand 522 0.80 (2.4) Norway 498 0.08 (2.4) Norway 490 -0.12 (2.6) Poland 495 0.03 (2.8) Poland 495 0.04 (2.4) Portugal 487 -0.30 (2.9) Portugal 466 -0.80 (3.1) Slovak Republic 497 0.03 (3.1) Slovak Republic 492 0.06 (2.8 ) Slovenia 501 0.19 (1.2) Slovenia 504 0.29 (1.0 Spain 483 0.41 (2.1) Spain 480 -0.41 (2.3 ) Sweden 494 -0.05 (2.9) Sweden 502 0.23 (2.4) Switzerland 534 1.29 (3.3) Switzerland 530 1.02 (3.2) Turkey 445 -1.69 (4.4) Turkey 424 -2.02 (4.9) United Kingdom 492 -0.11 (2.4) United Kingdom 495 0.04 (2.1) United States 487 -0.28 (3.6) United States 474 -0.57 (4.0) b.) b. ) b.) c. ) NOTE: The Mathematics scale ranges from 0 to 1000. Some apparent differences between estimates may not be statistically significant. SOURCE: Organization for Economic Cooperation and Development (OECD), Program for International Student Assessment (PISA), US Improvement from 2006-2009 standard deviations 2006 and 2009


