Question
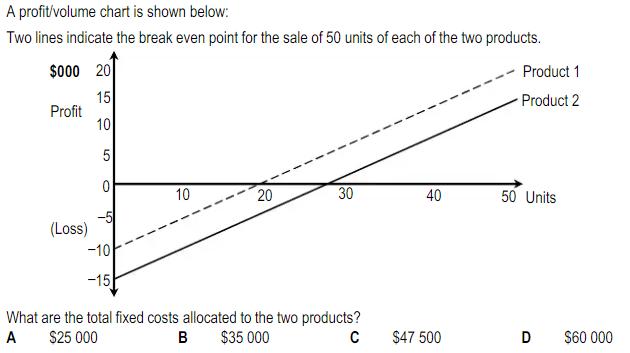
A profit/volume chart is shown below: Two lines indicate the break even point for the sale of 50 units of each of the two

A profit/volume chart is shown below: Two lines indicate the break even point for the sale of 50 units of each of the two products. $000 20 15 10 5 0 Profit (Loss) -10 -15 10 20 30 What are the total fixed costs allocated to the two products? A $25 000 B $35 000 C 40 $47 500 Product 1 Product 2 50 Units D $60 000
Step by Step Solution
3.51 Rating (148 Votes )
There are 3 Steps involved in it
Step: 1
Givien Proft volume chart break even for Sal...
Get Instant Access to Expert-Tailored Solutions
See step-by-step solutions with expert insights and AI powered tools for academic success
Step: 2

Step: 3

Ace Your Homework with AI
Get the answers you need in no time with our AI-driven, step-by-step assistance
Get StartedRecommended Textbook for
Principles Of Taxation For Business And Investment Planning 2016 Edition
Authors: Sally Jones, Shelley Rhoades Catanach
19th Edition
1259549259, 978-1259618536, 1259618536, 978-1259549250
Students also viewed these Accounting questions
Question
Answered: 1 week ago
Question
Answered: 1 week ago
Question
Answered: 1 week ago
Question
Answered: 1 week ago
Question
Answered: 1 week ago
Question
Answered: 1 week ago
Question
Answered: 1 week ago
Question
Answered: 1 week ago
Question
Answered: 1 week ago
Question
Answered: 1 week ago
Question
Answered: 1 week ago
Question
Answered: 1 week ago
Question
Answered: 1 week ago
Question
Answered: 1 week ago
Question
Answered: 1 week ago
Question
Answered: 1 week ago
Question
Answered: 1 week ago
Question
Answered: 1 week ago
Question
Answered: 1 week ago
Question
Answered: 1 week ago
Question
Answered: 1 week ago
Question
Answered: 1 week ago
View Answer in SolutionInn App


