

Answered step by step
Verified Expert Solution
Question
1 Approved Answer
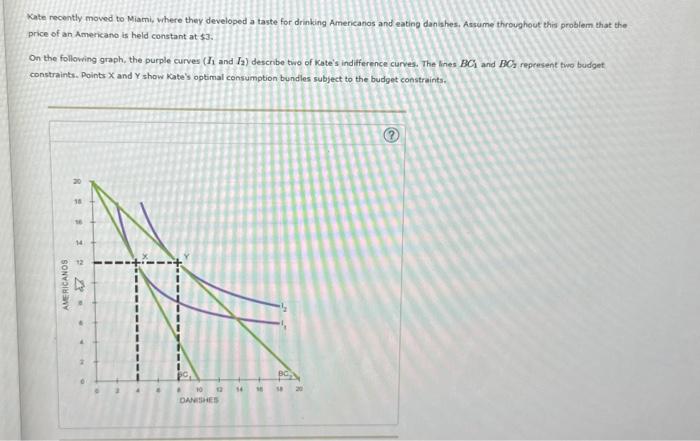
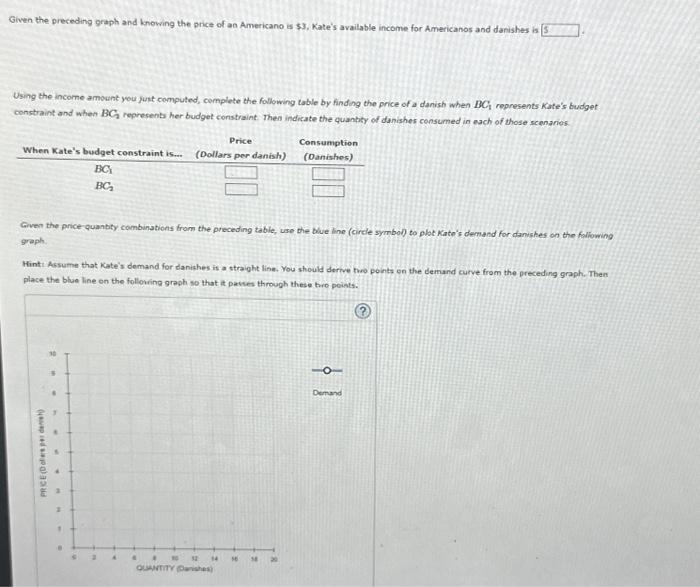
Kate recently moved to Miami, where they developed a taste for drinking Amencanos and eating danishes, Assume througheut this problem that the price of an
Step by Step Solution
There are 3 Steps involved in it
Step: 1

Get Instant Access to Expert-Tailored Solutions
See step-by-step solutions with expert insights and AI powered tools for academic success
Step: 2

Step: 3
Ace Your Homework with AI
Get the answers you need in no time with our AI-driven, step-by-step assistance
Get Started
Foreign Exchange Options An International Guide To Currency Options Trading And Practice
Authors: Alan Hicks
2nd Edition
185573253X,1845699017