

Question
ke a two way frequency table of the data shown in the Venn diagram Enter the frequencies in the table Grade Level Show Hints Freshman

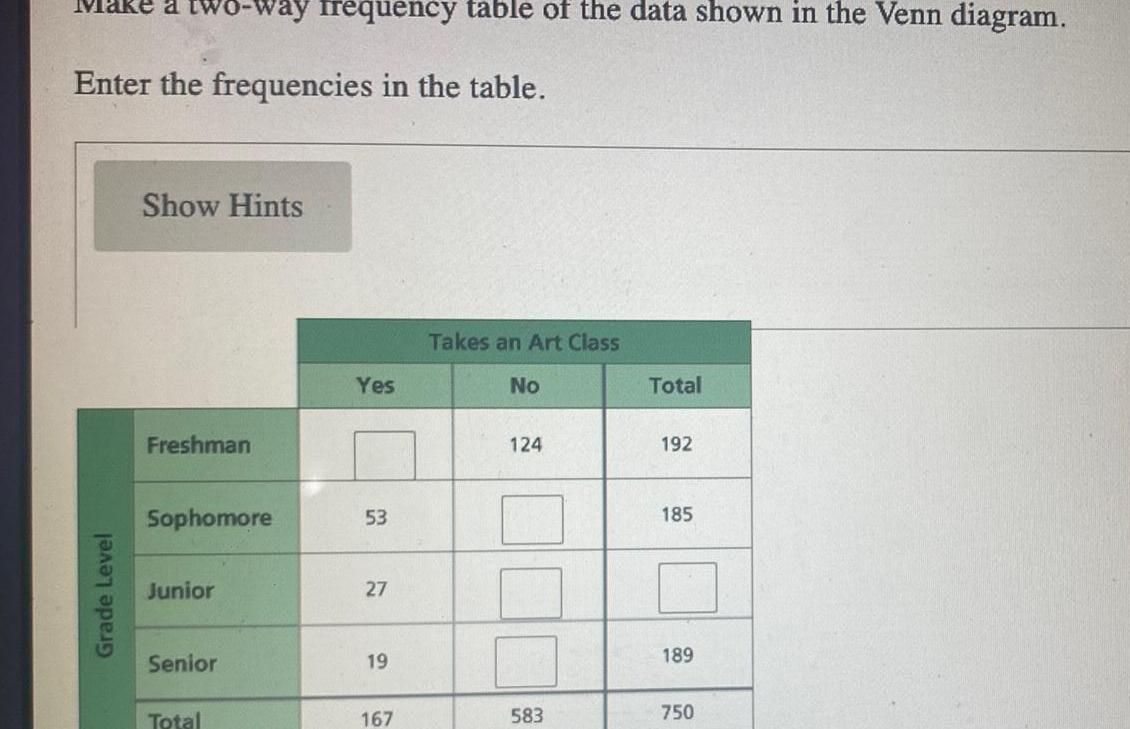
ke a two way frequency table of the data shown in the Venn diagram Enter the frequencies in the table Grade Level Show Hints Freshman Sophomore Junior Senior Total Yes 53 27 19 167 Takes an Art Class No 124 583 Total 192 185 189 750
Step by Step Solution
There are 3 Steps involved in it
Step: 1

Get Instant Access to Expert-Tailored Solutions
See step-by-step solutions with expert insights and AI powered tools for academic success
Step: 2

Step: 3
Ace Your Homework with AI
Get the answers you need in no time with our AI-driven, step-by-step assistance
Get Started
Visual Differential Geometry And Forms A Mathematical Drama In Five Acts
Authors: Tristan Needham
1st Edition
0691219893, 9780691219899