

Answered step by step
Verified Expert Solution
Question
1 Approved Answer
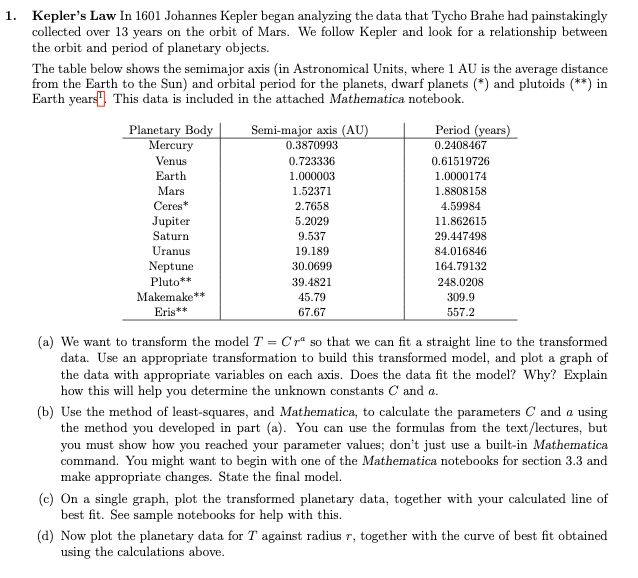
Kepler's Law In 1601 Johannes Kepler began analyzing the data that Tycho Brahe had painstakingly collected over 13 years on the orbit of Mars. We
Step by Step Solution
There are 3 Steps involved in it
Step: 1

Get Instant Access to Expert-Tailored Solutions
See step-by-step solutions with expert insights and AI powered tools for academic success
Step: 2

Step: 3
Ace Your Homework with AI
Get the answers you need in no time with our AI-driven, step-by-step assistance
Get Started
The Brain Audit Why Customers Buy And Why They Dont
Authors: Sean D'Souza, John Forde
1st Edition
0473175045, 978-0473175047