Answered step by step
Verified Expert Solution
Question
1 Approved Answer
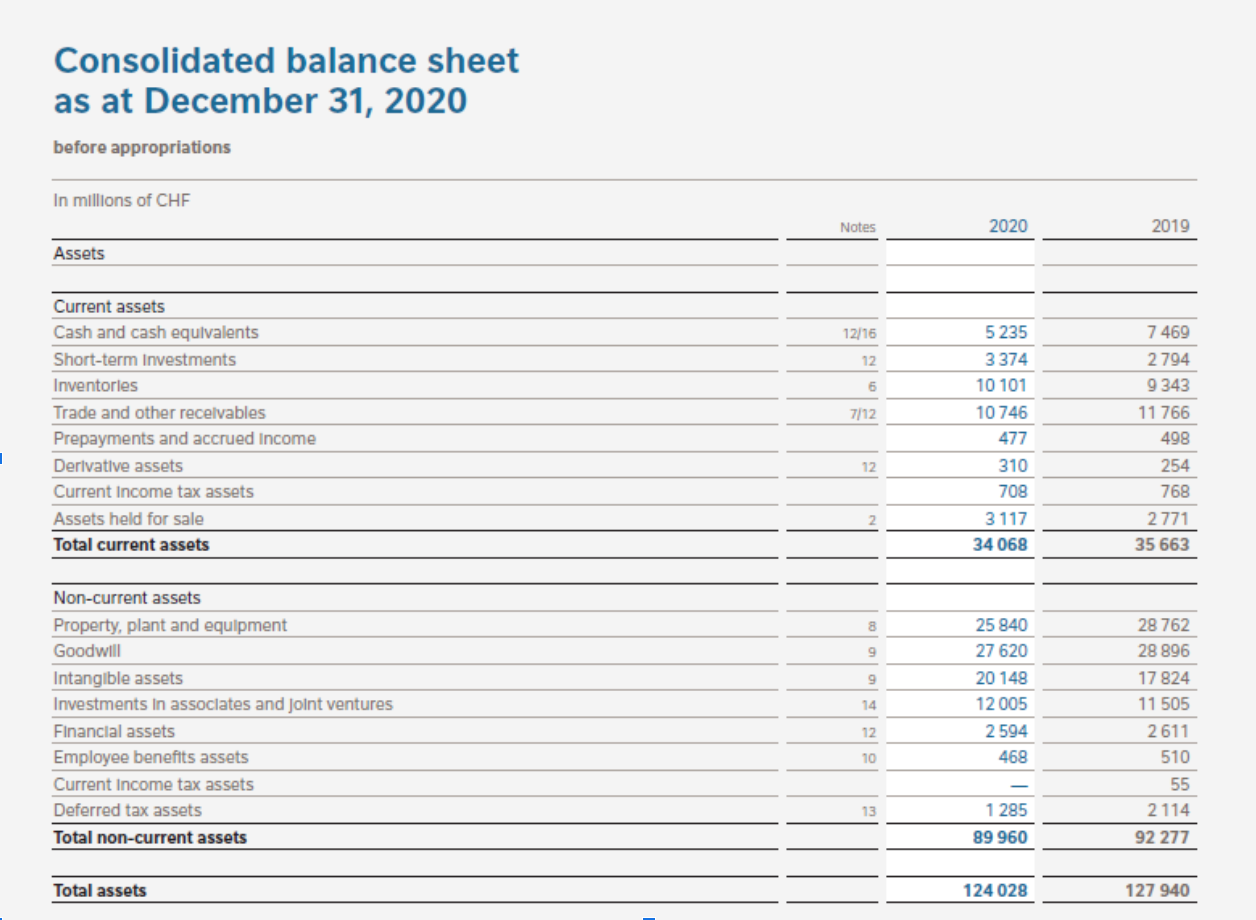
Kindly answer/do the PROFITABILITY for the summary of financial ratios Consolidated balance sheet as at December 31, 2020 before appropriations In millions of CHF Notes


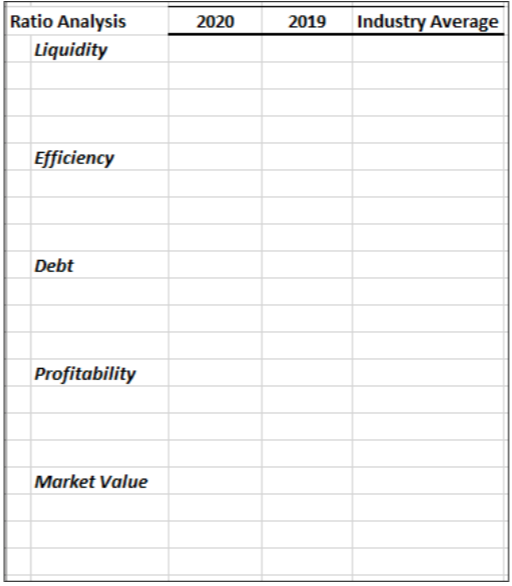
Kindly answer/do the PROFITABILITY for the summary of financial ratios

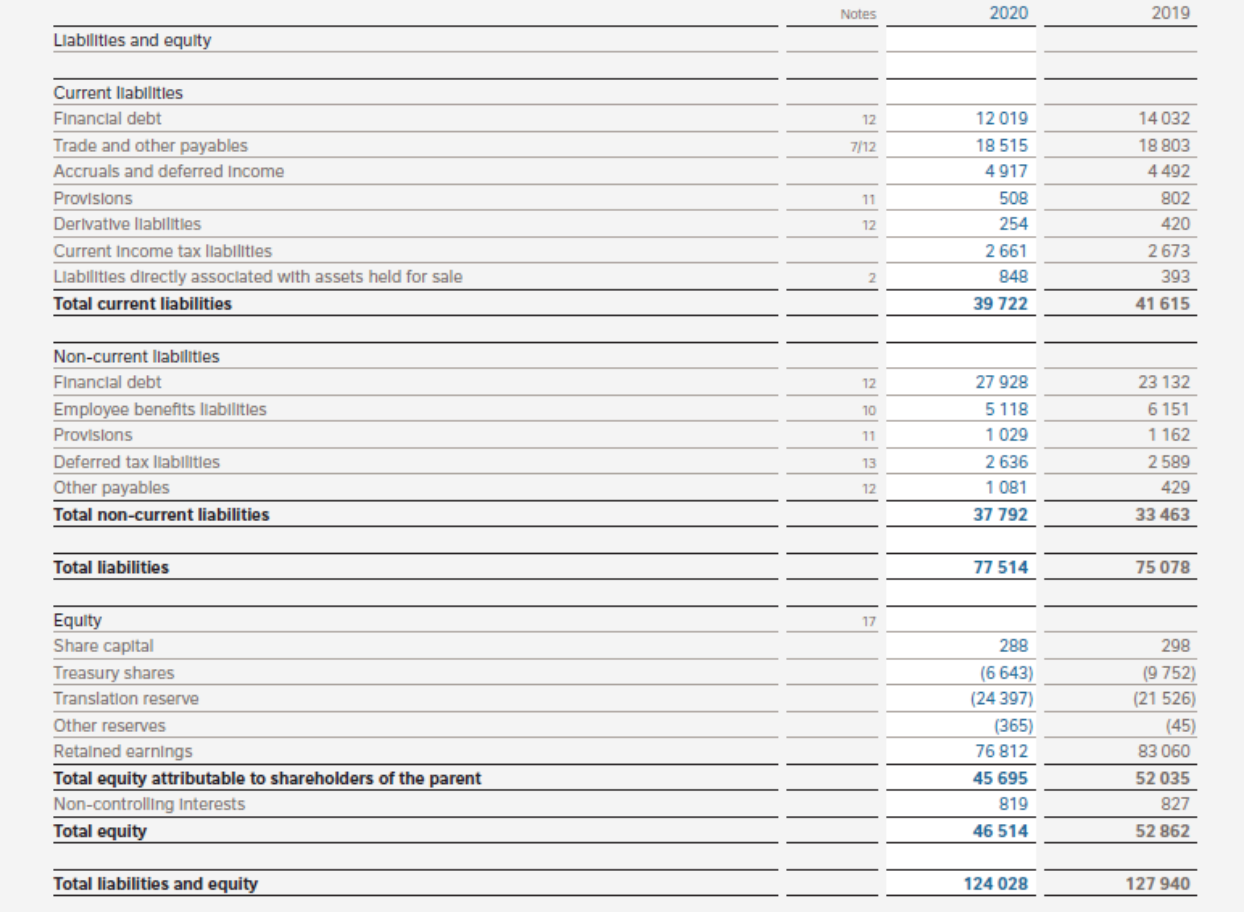
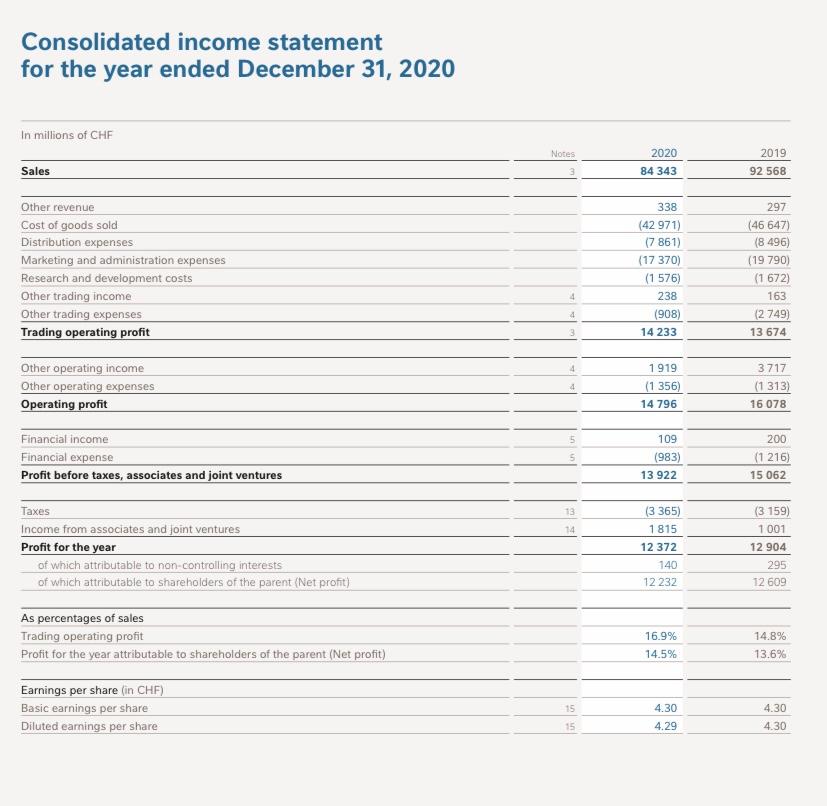
Consolidated balance sheet as at December 31, 2020 before appropriations In millions of CHF Notes 2020 2019 Assets 12/16 12 6 7/12 Current assets Cash and cash equivalents Short-term Investments Inventorles Trade and other recevables Prepayments and accrued Income Derivative assets Current Income tax assets Assets held for sale Total current assets 5235 3 374 10 101 10 746 477 310 708 3117 34 068 7469 2794 9343 11 766 498 254 768 2771 35 663 1 12 2 8 9 9 Non-current assets Property, plant and equipment Goodwill Intangible assets Investments in associates and joint ventures Financial assets Employee benefits assets Current Income tax assets Deferred tax assets Total non-current assets 25 840 27 620 20 148 12 005 2 594 468 14 12 28 762 28 896 17 824 11 505 2611 510 55 2114 92 277 10 13 1 285 89 960 Total assets 124 028 127 940 Notes 2020 2019 Llabilities and equity 12 7/12 Current liabilities Financial debt Trade and other payables Accruals and deferred Income Provisions Derivative liabilities Current Income tax liabilities Llabilities directly associated with assets held for sale Total current liabilities 11 12 019 18 515 4 917 508 254 2 661 848 39 722 14032 18 803 4492 802 420 2 673 393 12 2 41 615 12 10 Non-current liabilities Financial debt Employee benefits liabilities Provisions Deferred tax liabilities Other payables Total non-current liabilities 27 928 5 118 1 029 2636 1 081 23 132 6151 1 162 11 13 12 2589 429 33 463 37 792 Total liabilities 77 514 75 078 17 Equity Share capital Treasury shares Translation reserve Other reserves Retained earnings Total equity attributable to shareholders of the parent Non-controlling Interests Total equity 288 (6 643) (24 397) (365) 76 812 45 695 819 298 (9 752) (21 526) (45) 83 060 52 035 827 46 514 52 862 Total liabilities and equity 124 028 127 940 Consolidated income statement for the year ended December 31, 2020 In millions of CHF Notes 2020 84 343 2019 92 568 Sales 338 Other revenue Cost of goods sold Distribution expenses Marketing and administration expenses Research and development costs Other trading income Other trading expenses Trading operating profit (42 971) (7 861) (17370) (1 576) 238 (908) 14 233 297 (46 647) (8 496) (19 790) (1 672) 163 (2 749) 13 674 4. Other operating income Other operating expenses Operating profit 1919 (1356) 14 796 3717 (1 313) 16 078 109 Financial income Financial expense Profit before taxes, associates and joint ventures (983) 13 922 200 (1 216) 15 062 13 (3 365) 14 Taxes Income from associates and joint ventures Profit for the year of which attributable to non-controlling interests of which attributable to shareholders of the parent (Net profit) 1815 12 372 140 (3 159) 1 001 12 904 295 12 609 12 232 As percentages of sales Trading operating profit Profit for the year attributable to shareholders of the parent (Net profit) 16.9% 14.5% 14.8% 13.6% Earnings per share (in CHF) Basic earnings per share Diluted earnings per share 15 4.30 4.29 4.30 4.30 15 2020 2019 Industry Average Ratio Analysis Liquidity Efficiency Debt Profitability Market Value Consolidated balance sheet as at December 31, 2020 before appropriations In millions of CHF Notes 2020 2019 Assets 12/16 12 6 7/12 Current assets Cash and cash equivalents Short-term Investments Inventorles Trade and other recevables Prepayments and accrued Income Derivative assets Current Income tax assets Assets held for sale Total current assets 5235 3 374 10 101 10 746 477 310 708 3117 34 068 7469 2794 9343 11 766 498 254 768 2771 35 663 1 12 2 8 9 9 Non-current assets Property, plant and equipment Goodwill Intangible assets Investments in associates and joint ventures Financial assets Employee benefits assets Current Income tax assets Deferred tax assets Total non-current assets 25 840 27 620 20 148 12 005 2 594 468 14 12 28 762 28 896 17 824 11 505 2611 510 55 2114 92 277 10 13 1 285 89 960 Total assets 124 028 127 940 Notes 2020 2019 Llabilities and equity 12 7/12 Current liabilities Financial debt Trade and other payables Accruals and deferred Income Provisions Derivative liabilities Current Income tax liabilities Llabilities directly associated with assets held for sale Total current liabilities 11 12 019 18 515 4 917 508 254 2 661 848 39 722 14032 18 803 4492 802 420 2 673 393 12 2 41 615 12 10 Non-current liabilities Financial debt Employee benefits liabilities Provisions Deferred tax liabilities Other payables Total non-current liabilities 27 928 5 118 1 029 2636 1 081 23 132 6151 1 162 11 13 12 2589 429 33 463 37 792 Total liabilities 77 514 75 078 17 Equity Share capital Treasury shares Translation reserve Other reserves Retained earnings Total equity attributable to shareholders of the parent Non-controlling Interests Total equity 288 (6 643) (24 397) (365) 76 812 45 695 819 298 (9 752) (21 526) (45) 83 060 52 035 827 46 514 52 862 Total liabilities and equity 124 028 127 940 Consolidated income statement for the year ended December 31, 2020 In millions of CHF Notes 2020 84 343 2019 92 568 Sales 338 Other revenue Cost of goods sold Distribution expenses Marketing and administration expenses Research and development costs Other trading income Other trading expenses Trading operating profit (42 971) (7 861) (17370) (1 576) 238 (908) 14 233 297 (46 647) (8 496) (19 790) (1 672) 163 (2 749) 13 674 4. Other operating income Other operating expenses Operating profit 1919 (1356) 14 796 3717 (1 313) 16 078 109 Financial income Financial expense Profit before taxes, associates and joint ventures (983) 13 922 200 (1 216) 15 062 13 (3 365) 14 Taxes Income from associates and joint ventures Profit for the year of which attributable to non-controlling interests of which attributable to shareholders of the parent (Net profit) 1815 12 372 140 (3 159) 1 001 12 904 295 12 609 12 232 As percentages of sales Trading operating profit Profit for the year attributable to shareholders of the parent (Net profit) 16.9% 14.5% 14.8% 13.6% Earnings per share (in CHF) Basic earnings per share Diluted earnings per share 15 4.30 4.29 4.30 4.30 15 2020 2019 Industry Average Ratio Analysis Liquidity Efficiency Debt Profitability Market Value
Step by Step Solution
There are 3 Steps involved in it
Step: 1

Get Instant Access to Expert-Tailored Solutions
See step-by-step solutions with expert insights and AI powered tools for academic success
Step: 2

Step: 3

Ace Your Homework with AI
Get the answers you need in no time with our AI-driven, step-by-step assistance
Get Started


