

Answered step by step
Verified Expert Solution
Question
1 Approved Answer
kindly assist with the above questions 1. Cash flow or Cash flow/share trend over five-years in table and graph form (line or bar) this can
kindly assist with the above questions
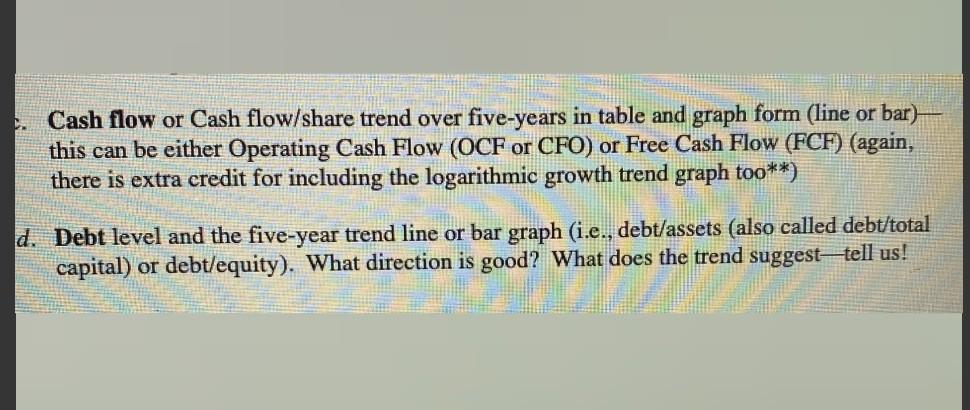
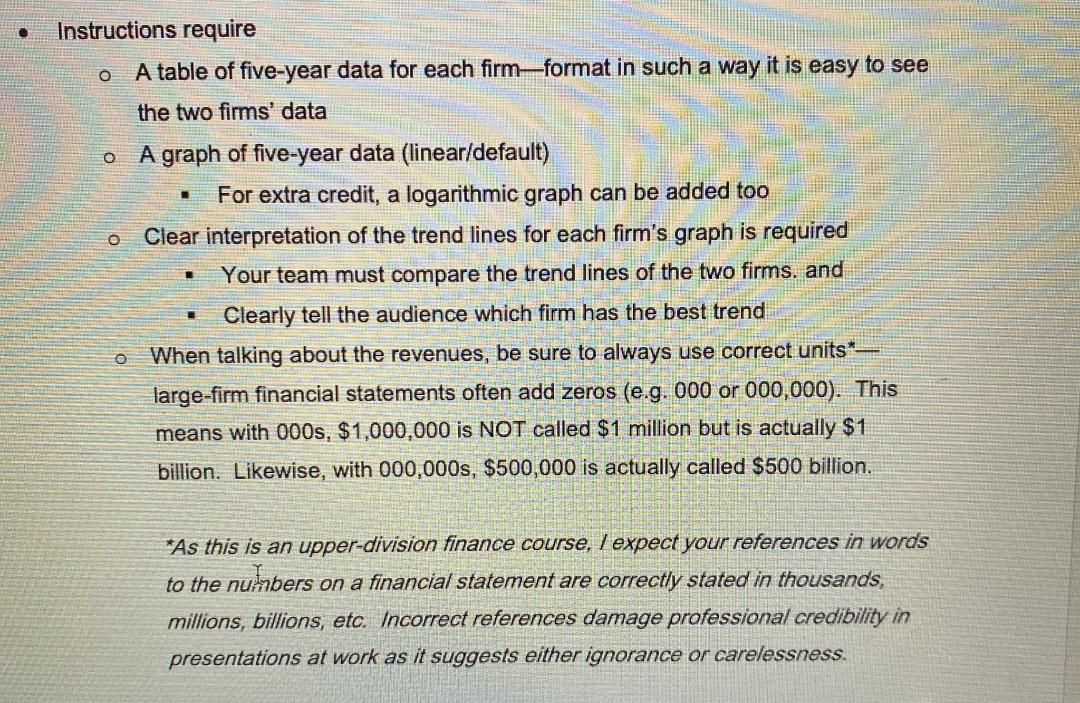
1. Cash flow or Cash flow/share trend over five-years in table and graph form (line or bar) this can be either Operating Cash Flow (OCF or CFO) or Free Cash Flow (FCF) (again, there is extra credit for including the logarithmic growth trend graph too**) d. Debt level and the five-year trend line or bar graph (i.e., debt/assets (also called debt/total capital) or debt/equity). What direction is good? What does the trend suggesttell us! o O Instructions require A table of five-year data for each firmformat in such a way it is easy to see the two firms' data A graph of five-year data (linear/default) For extra credit, a logarithmic graph can be added too Clear interpretation of the trend lines for each firm's graph is required Your team must compare the trend lines of the two firms, and Clearly tell the audience which firm has the best trend When talking about the revenues, be sure to always use correct units* large-firm financial statements often add zeros (e.g. 000 or 000,000). This means with 000s, $1,000,000 is NOT called $1 million but is actually $1 billion. Likewise, with 000,000s, $500,000 is actually called $500 billion. o *As this is an upper-division finance course, / expect your references in words to the numbers on a financial statement are correctly stated in thousands, millions, billions, etc. Incorrect references damage professional credibility in presentations at work as it suggests either ignorance or carelessness. 1. Cash flow or Cash flow/share trend over five-years in table and graph form (line or bar) this can be either Operating Cash Flow (OCF or CFO) or Free Cash Flow (FCF) (again, there is extra credit for including the logarithmic growth trend graph too**) d. Debt level and the five-year trend line or bar graph (i.e., debt/assets (also called debt/total capital) or debt/equity). What direction is good? What does the trend suggesttell us! o O Instructions require A table of five-year data for each firmformat in such a way it is easy to see the two firms' data A graph of five-year data (linear/default) For extra credit, a logarithmic graph can be added too Clear interpretation of the trend lines for each firm's graph is required Your team must compare the trend lines of the two firms, and Clearly tell the audience which firm has the best trend When talking about the revenues, be sure to always use correct units* large-firm financial statements often add zeros (e.g. 000 or 000,000). This means with 000s, $1,000,000 is NOT called $1 million but is actually $1 billion. Likewise, with 000,000s, $500,000 is actually called $500 billion. o *As this is an upper-division finance course, / expect your references in words to the numbers on a financial statement are correctly stated in thousands, millions, billions, etc. Incorrect references damage professional credibility in presentations at work as it suggests either ignorance or carelessnessStep by Step Solution
There are 3 Steps involved in it
Step: 1

Get Instant Access to Expert-Tailored Solutions
See step-by-step solutions with expert insights and AI powered tools for academic success
Step: 2

Step: 3
Ace Your Homework with AI
Get the answers you need in no time with our AI-driven, step-by-step assistance
Get Started
Business And The Euro Business Groups And The Politics Of EMU In Britain And Germany And The United Kingdom
Authors: Mark K. Duckenfield
1st Edition
1403998639,0230627242