Kindly help me to answer the attached questions below.
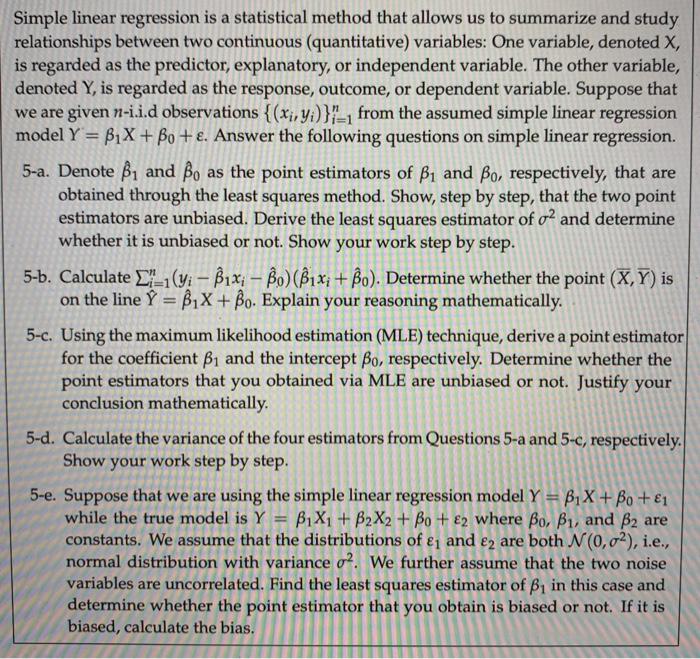
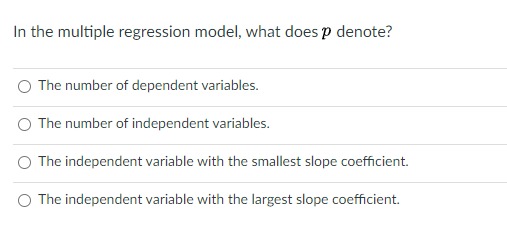
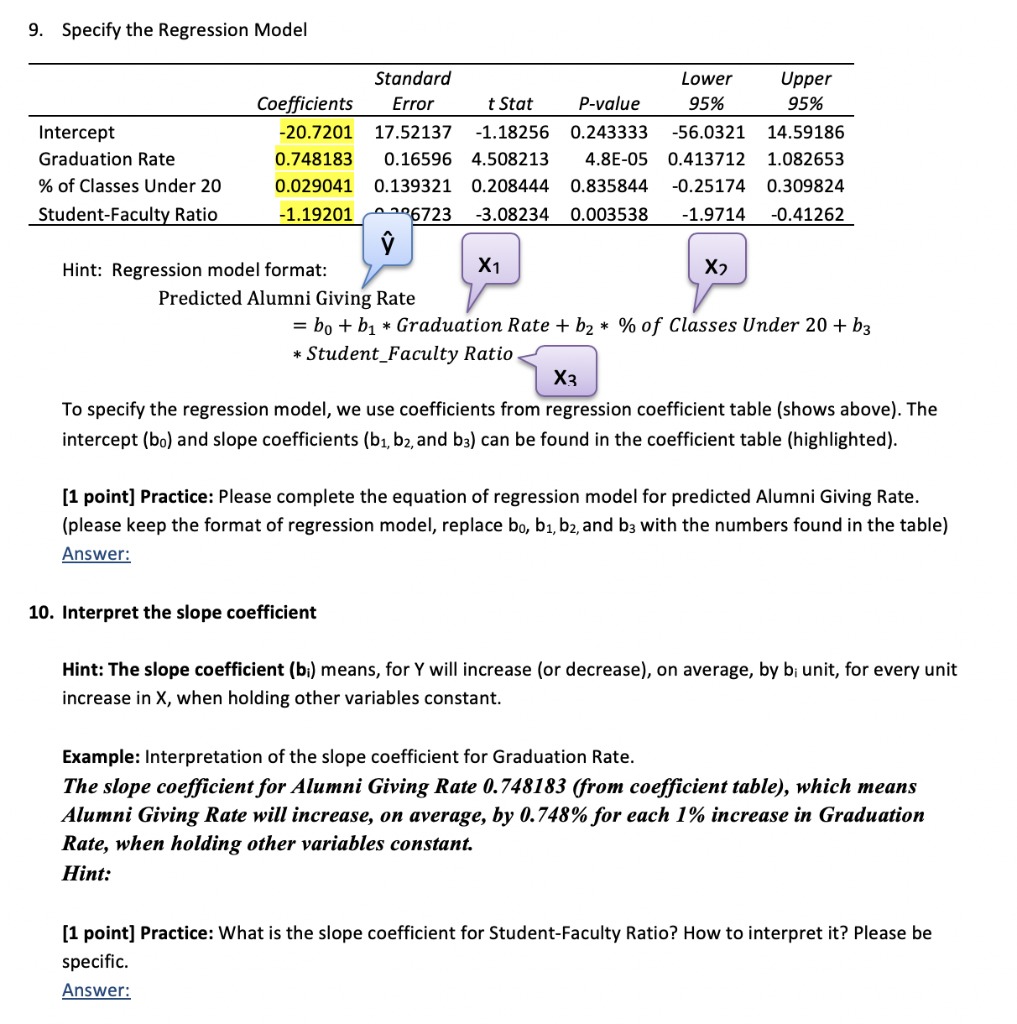
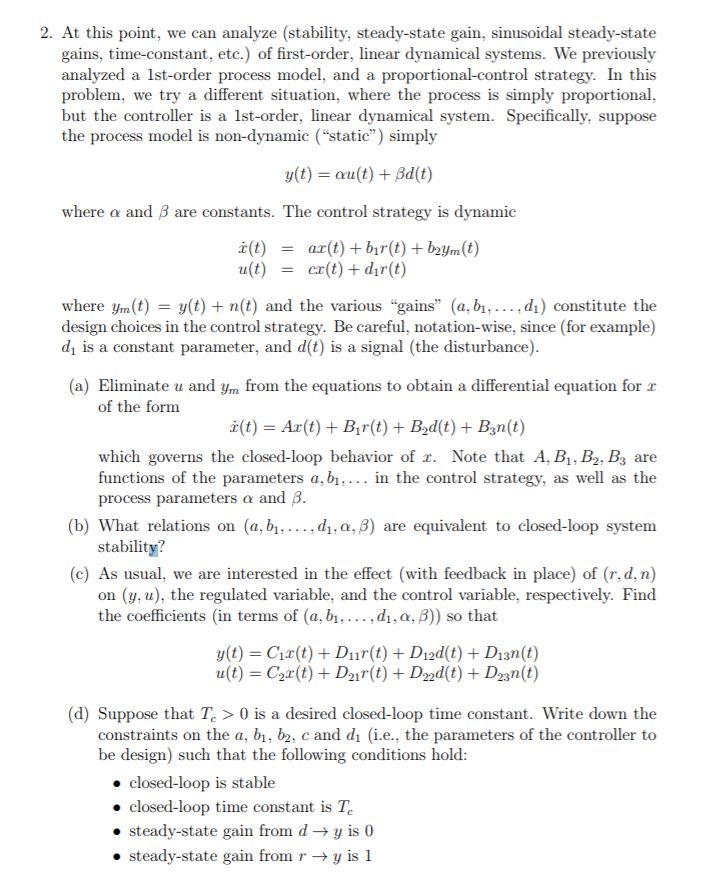
Simple linear regression is a statistical method that allows us to summarize and study relationships between two continuous (quantitative) variables: One variable, denoted X, is regarded as the predictor, explanatory, or independent variable. The other variable, denoted Y, is regarded as the response, outcome, or dependent variable. Suppose that we are given n-i.i.d observations { (x;, y;)}"_, from the assumed simple linear regression model Y = BIX + Bo + . Answer the following questions on simple linear regression. 5-a. Denote 1 and Bo as the point estimators of B, and Bo, respectively, that are obtained through the least squares method. Show, step by step, that the two point estimators are unbiased. Derive the least squares estimator of of and determine whether it is unbiased or not. Show your work step by step. 5-b. Calculate _'_1(yi - Bix; - Bo) (Bix, + Bo). Determine whether the point (X, Y) is on the line Y = 1X + Bo. Explain your reasoning mathematically. 5-c. Using the maximum likelihood estimation (MLE) technique, derive a point estimator for the coefficient B1 and the intercept Bo, respectively. Determine whether the point estimators that you obtained via MLE are unbiased or not. Justify your conclusion mathematically. 5-d. Calculate the variance of the four estimators from Questions 5-a and 5-c, respectively. Show your work step by step. 5-e. Suppose that we are using the simple linear regression model Y = B1 X + Bo + 1 while the true model is Y = 1X1 + B2X2 + Bo + 82 where Bo, B1, and B2 are constants. We assume that the distributions of &, and e2 are both N(0,02), i.e., normal distribution with variance o?. We further assume that the two noise variables are uncorrelated. Find the least squares estimator of B, in this case and determine whether the point estimator that you obtain is biased or not. If it is biased, calculate the bias.In the multiple regression model, what does p denote? O The number of dependent variables. O The number of independent variables. O The independent variable with the smallest slope coefficient. O The independent variable with the largest slope coefficient.9. Specify the Regression Model Standard Lower Upper Coefficients Error t Stat P-value 95% 95% Intercept 20.7201 17.52137 -1.18256 0.243333 -56.0321 14.59186 Graduation Rate 0.748183 0.16596 4.508213 4.8E-05 0.413712 1.082653 % of Classes Under 20 0.029041 0.139321 0.208444 0.835844 -0.25174 0.309824 Student-Faculty Ratio -1.19201 0206723 -3.08234 0.003538 -1.9714 -0.41262 Hint: Regression model format: X1 X? Predicted Alumni Giving Rate = bo + b1 * Graduation Rate + b2 * % of Classes Under 20 + b3 * Student_Faculty Ratio X3 To specify the regression model, we use coefficients from regression coefficient table (shows above). The intercept (bo) and slope coefficients (b1, b2, and b3) can be found in the coefficient table (highlighted). [1 point] Practice: Please complete the equation of regression model for predicted Alumni Giving Rate. (please keep the format of regression model, replace bo, b1, b2, and b3 with the numbers found in the table) Answer: 10. Interpret the slope coefficient Hint: The slope coefficient (bi) means, for Y will increase (or decrease), on average, by b; unit, for every unit increase in X, when holding other variables constant. Example: Interpretation of the slope coefficient for Graduation Rate. The slope coefficient for Alumni Giving Rate 0.748183 (from coefficient table), which means Alumni Giving Rate will increase, on average, by 0.748% for each 1% increase in Graduation Rate, when holding other variables constant. Hint: [1 point] Practice: What is the slope coefficient for Student-Faculty Ratio? How to interpret it? Please be specific. Answer:2. At this point, we can analyze (stability, steady-state gain, sinusoidal steady-state gains, time-constant, etc.) of first-order, linear dynamical systems. We previously analyzed a Ist-order process model, and a proportional-control strategy. In this problem, we try a different situation, where the process is simply proportional, but the controller is a Ist-order, linear dynamical system. Specifically, suppose the process model is non-dynamic ("static" ) simply y(t) = cu(t) + Bd(t) where o and B are constants. The control strategy is dynamic i (t) = ar(t) + bir(t) + bzym(t) u(t) = cr(t) + dir(t) where ym(t) = y(t) + n(t) and the various "gains" (a, bi, . .., di) constitute the design choices in the control strategy. Be careful, notation-wise, since (for example) d, is a constant parameter, and d(t) is a signal (the disturbance). (a) Eliminate u and ym from the equations to obtain a differential equation for r of the form r(t) = Ar(t) + Bir(t) + Bad(t) + Ban(t) which governs the closed-loop behavior of r. Note that A, B1, B2, By are functions of the parameters a, b1, ... in the control strategy, as well as the process parameters o and B. (b) What relations on (a, b1. .... dj, or, B) are equivalent to closed-loop system stability? (c) As usual, we are interested in the effect (with feedback in place) of (r, d, n) on (y, u), the regulated variable, and the control variable, respectively. Find the coefficients (in terms of (a, bi, . . ., d1, 0, B)) so that y(t) = Cix(t) + Dur(t) + Died(t) + Dian(t) u(t) = Car(t) + Dar(t) + Dad(t) + Dzan(t) (d) Suppose that T. > 0 is a desired closed-loop time constant. Write down the constraints on the a, b1, b2, c and di (i.e., the parameters of the controller to be design) such that the following conditions hold: . closed-loop is stable . closed-loop time constant is To . steady-state gain from d -> y is 0 . steady-state gain from r - y is 12. At this point, we can analyze (stability, steady-state gain, sinusoidal steady-state gains, time-constant, etc.) of first-order, linear dynamical systems. We previously analyzed a Ist-order process model, and a proportional-control strategy. In this problem, we try a different situation, where the process is simply proportional, but the controller is a Ist-order, linear dynamical system. Specifically, suppose the process model is non-dynamic ("static" ) simply y(t) = cu(t) + Bd(t) where o and B are constants. The control strategy is dynamic i (t) = ar(t) + bir(t) + bzym(t) u(t) = cr(t) + dir(t) where ym(t) = y(t) + n(t) and the various "gains" (a, bi, . .., di) constitute the design choices in the control strategy. Be careful, notation-wise, since (for example) d, is a constant parameter, and d(t) is a signal (the disturbance). (a) Eliminate u and ym from the equations to obtain a differential equation for r of the form r(t) = Ar(t) + Bir(t) + Bad(t) + Ban(t) which governs the closed-loop behavior of r. Note that A, B1, B2, By are functions of the parameters a, b1, ... in the control strategy, as well as the process parameters o and B. (b) What relations on (a, b1. .... dj, or, B) are equivalent to closed-loop system stability? (c) As usual, we are interested in the effect (with feedback in place) of (r, d, n) on (y, u), the regulated variable, and the control variable, respectively. Find the coefficients (in terms of (a, bi, . . ., d1, 0, B)) so that y(t) = Cix(t) + Dur(t) + Died(t) + Dian(t) u(t) = Car(t) + Dar(t) + Dad(t) + Dzan(t) (d) Suppose that T. > 0 is a desired closed-loop time constant. Write down the constraints on the a, b1, b2, c and di (i.e., the parameters of the controller to be design) such that the following conditions hold: . closed-loop is stable . closed-loop time constant is To . steady-state gain from d -> y is 0 . steady-state gain from r - y is 1