Answered step by step
Verified Expert Solution
Question
1 Approved Answer
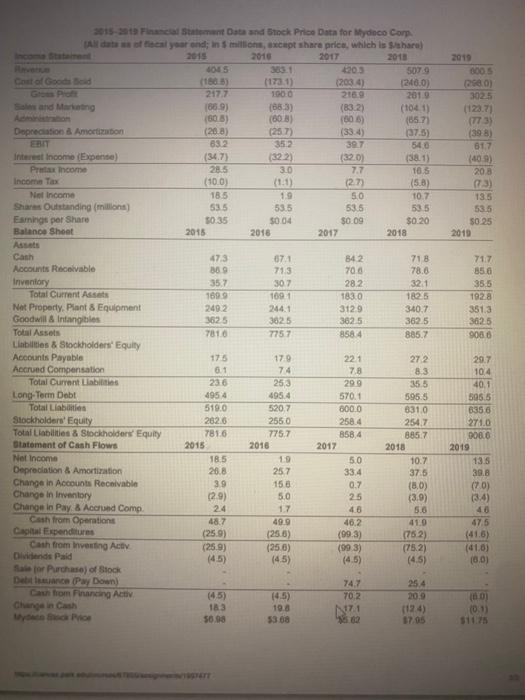
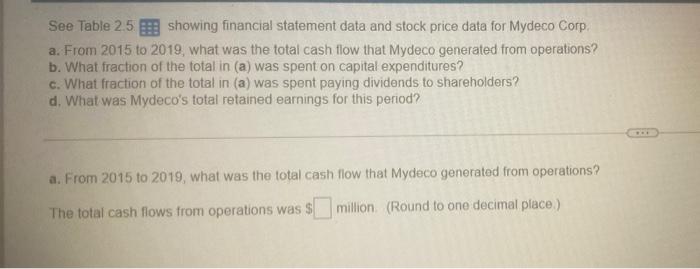
Kindly solve all questions. a,b,c and d 2015- Financial Statement Data and Stock Price Data for Mydeco Corp All data of a year and; in
Kindly solve all questions. a,b,c and d 

2015- Financial Statement Data and Stock Price Data for Mydeco Corp All data of a year and; in millions, except share price, which is share 2015 2010 2017 2018 045 5079 Cost of Goods sold (1803) (1730 (203.4 240,0) Gas Por 2177 1000 2150 2010 and Marketing (809) (683) (83.2) (1041 808) (608) 1806) (557) Depreciation & Amortization (208) (257) (334) (37.5) ERIT 832 35.2 397 540 Interest Income (Expense) (347) (320) (38.1 Pretax income 28.5 3.0 7.7 10.5 Income Tax (100) (1.1) (2.7 (5.8) Net Income 18.5 19 Shares Outstanding (millons) 535 53.5 53.5 Earnings per Share 50.35 5004 $0.09 $0.20 Balance Sheet 2015 2018 2017 2018 2019 0005 28 ) 3025 (128.7 (T3) (398 817 (409) 203 50 10.7 535 135 535 50 25 2010 47.3 30.9 35.7 1899 2492 3625 7810 07 713 307 1091 244.1 3625 7757 842 700 282 183.0 3129 3625 8584 718 78.6 32.1 1825 340.7 382.5 885.7 717 35.0 35.5 1928 351.3 3825 9086 Canh Accounts Receivable Inventory Total Current Assets Net Property. Plant & Equipment Goodwill & Intangibles Total Assets Liabilities & Stockholders' Equity Accounts Payable Accrued Compensation Total Current Liabilities Long-Term Debt Total Liabiti Stockholders' Equity Total Liabilities & Stockholders' Equity Statement of Cash Flows Net Income Depreciation & Amortization Change in Accounts Receivable Change in Inventory Change in Pay & Accrund Comp. Cash from Operations Capital Expenditures Cash from investing Activ Dividends Paid sale for purchase of Stock Dabance Pay Down) Cantom Financing Act Change in Cash 17.5 6.1 236 4954 519.0 262.6 7816 2015 18.5 26.8 39 (2.9) 24 48.7 (259) (25.9) (45) 170 74 253 495.4 520.7 2550 7757 2016 19 25.7 158 29.7 104 40.1 595.5 6356 271.0 2006 2019 221 7.8 299 570.1 000.0 2584 8584 2017 5.0 33.4 0.7 25 4.6 402 (99.3) (993) (4.5) 272 8.3 35.5 595.5 831.0 254,7 885.7 2018 10.7 375 (8,0) (3.9) 5.6 410 (752) (75.2) (45) 135 39.8 (7.0) 50 1.7 49.9 (256) (256) (4.5) 46 475 (41.6) (410) (0,0) (45) 183 56.98 (4.5) 100 5300 747 70.2 N171 25.4 20.9 (124) 17.05 100) (0:1) See Table 2.5 B showing financial statement data and stock price data for Mydeco Corp a. From 2015 to 2019, what was the total cash flow that Mydeco generated from operations? b. What fraction of the total in (a) was spent on capital expenditures? c. What fraction of the total in (a) was spent paying dividends to shareholders? d. What was Mydeco's total retained earnings for this period? a. From 2015 to 2019, what was the total cash flow that Mydeco generated from operations? The total cash flows from operations was $ million (Round to one decimal place) 

Step by Step Solution
There are 3 Steps involved in it
Step: 1

Get Instant Access to Expert-Tailored Solutions
See step-by-step solutions with expert insights and AI powered tools for academic success
Step: 2

Step: 3

Ace Your Homework with AI
Get the answers you need in no time with our AI-driven, step-by-step assistance
Get Started


