Kindly solve the question
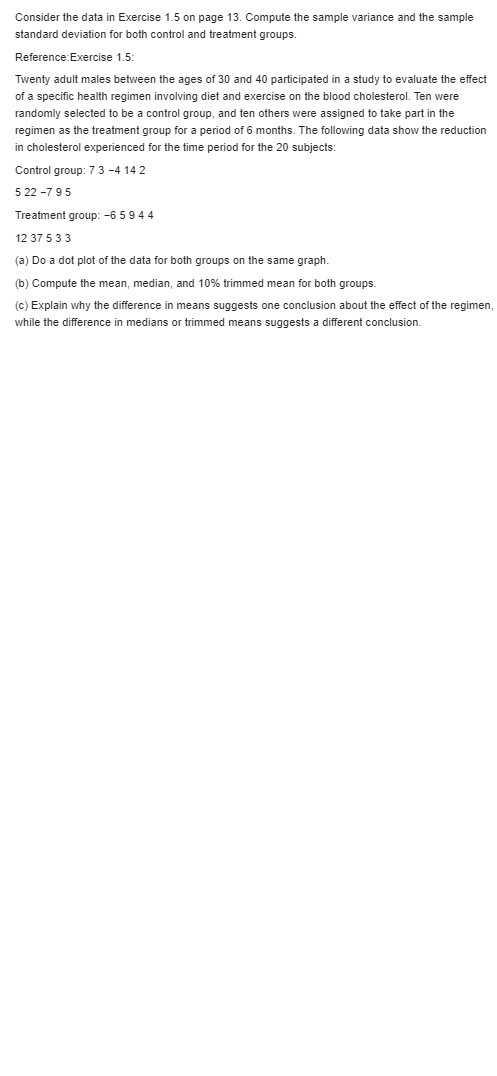
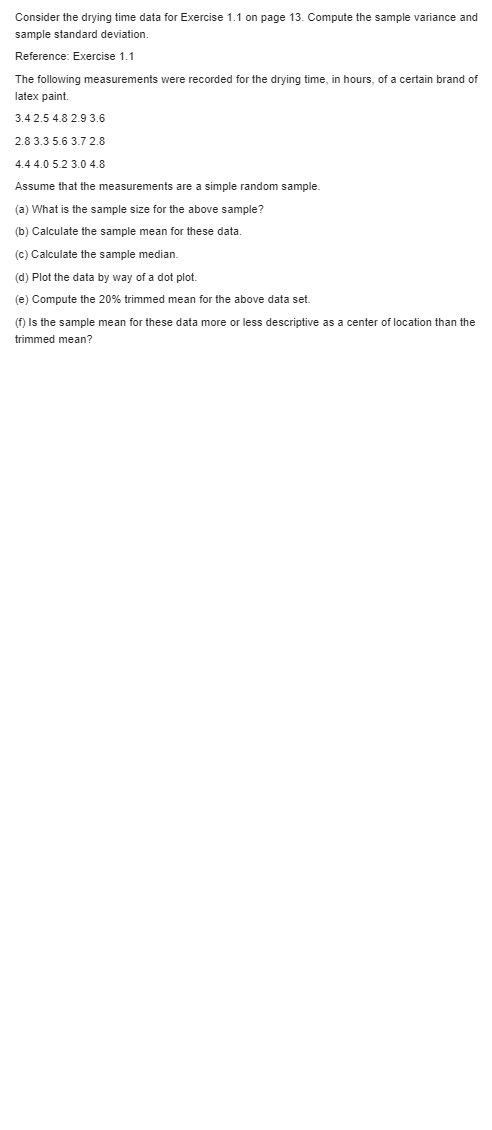
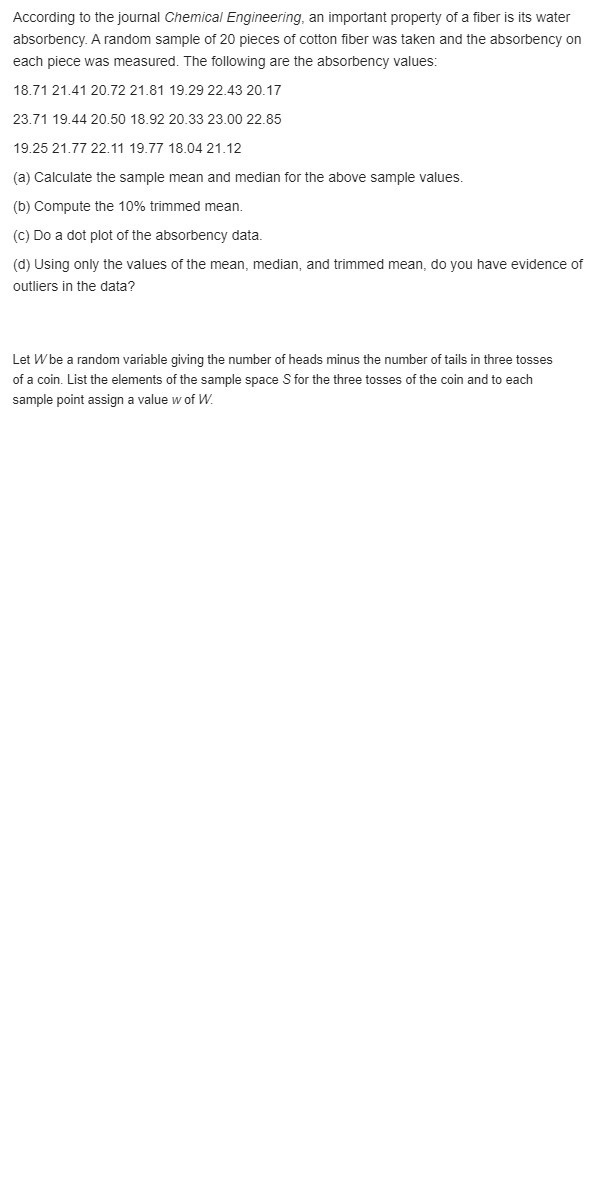
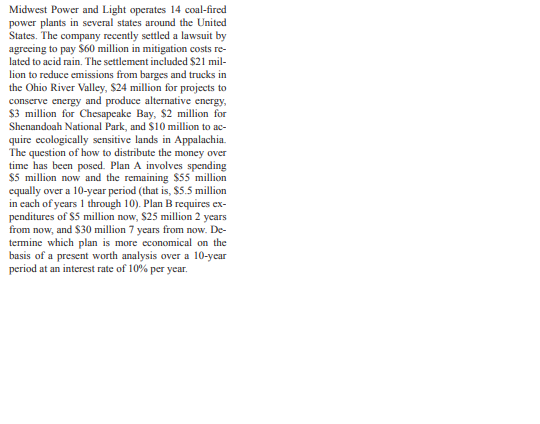
Consider the data in Exercise 1.5 on page 13. Compute the sample variance and the sample standard deviation for both control and treatment groups. Reference Exercise 1.5: Twenty adult males between the ages of 30 and 40 participated in a study to evaluate the effect of a specific health regimen involving diet and exercise on the blood cholesterol. Ten were randomly selected to be a control group, and ten others were assigned to take part in the regimen as the treatment group for a period of 6 months. The following data show the reduction in cholesterol experienced for the time period for the 20 subjects: Control group: 7 3 -4 14 2 522 -7 95 Treatment group: -6 5 9 4 4 12 37 5 3 3 (a) Do a dot plot of the data for both groups on the same graph. (b) Compute the mean, median, and 10% trimmed mean for both groups. (c) Explain why the difference in means suggests one conclusion about the effect of the regimen, while the difference in medians or trimmed means suggests a different conclusion.Consider the drying time data for Exercise 1.1 on page 13. Compute the sample variance and sample standard deviation. Reference: Exercise 1.1 The following measurements were recorded for the drying tine. in hours. of a certain brand of latex pa'nt. 3.4 2.5 4.8 2.9 3.6 2.8 3.3 5.5 3.? 2.3 4.4 4.0 5.2 3.0 4.3 Assume that the measurements are a simple random sample. {a} What is the sample size for the above sample? {In} Calculate the sample mean for these data. {c} Calculate the sample median. {djl Plot the data by way of a dot plot. {e} Compute the 20% trirm'ned mean for the above data set. { Is the sample mean for these data more or less descriptive as a center of location than the trimmed mean? According to the journal Chemical Engineering, an important property of a fiber is its water absorbency. A random sample of 20 pieces of cotton fiber was taken and the absorbency on each piece was measured. The following are the absorbency values: 18.71 21.41 20.72 21.81 19.29 22.43 20.17 23.71 19.44 20.50 18.92 20.33 23.00 22.85 19.25 21.77 22.11 19.77 18.04 21.12 (a) Calculate the sample mean and median for the above sample values. (b) Compute the 10% trimmed mean. (c) Do a dot plot of the absorbency data. (d) Using only the values of the mean, median, and trimmed mean, do you have evidence of outliers in the data? Let Wbe a random variable giving the number of heads minus the number of tails in three tosses of a coin. List the elements of the sample space S for the three tosses of the coin and to each sample point assign a value w of W.Midwest Power and Light operates 14 coal-fired power plants in several states around the United States. The company recently settled a lawsuit by agreeing to pay $60 million in mitigation costs re- lated to acid rain. The settlement included $21 mil- lion to reduce emissions from barges and trucks in the Ohio River Valley, $24 million for projects to conserve energy and produce alternative energy, $3 million for Chesapeake Bay, $2 million for Shenandoah National Park, and $10 million to ac- quire ecologically sensitive lands in Appalachia. The question of how to distribute the money over time has been posed. Plan A involves spending $5 million now and the remaining $55 million equally over a 10-year period (that is, $5.5 million in each of years 1 through 10). Plan B requires ex- penditures of $5 million now, $25 million 2 years from now, and $30 million 7 years from now. De- termine which plan is more economical on the basis of a present worth analysis over a 10-year period at an interest rate of 10% per year.Construct a graph of the cumulative distribution function of Exercise 3. 15. Reference: Exercise 3. 15: Find the cumulative distribution function of the random variable X representing the number of defectives in Exercise 3.11. Then using F(x), find (a) P(X = 1); (b) P(0
