kindly solve the question
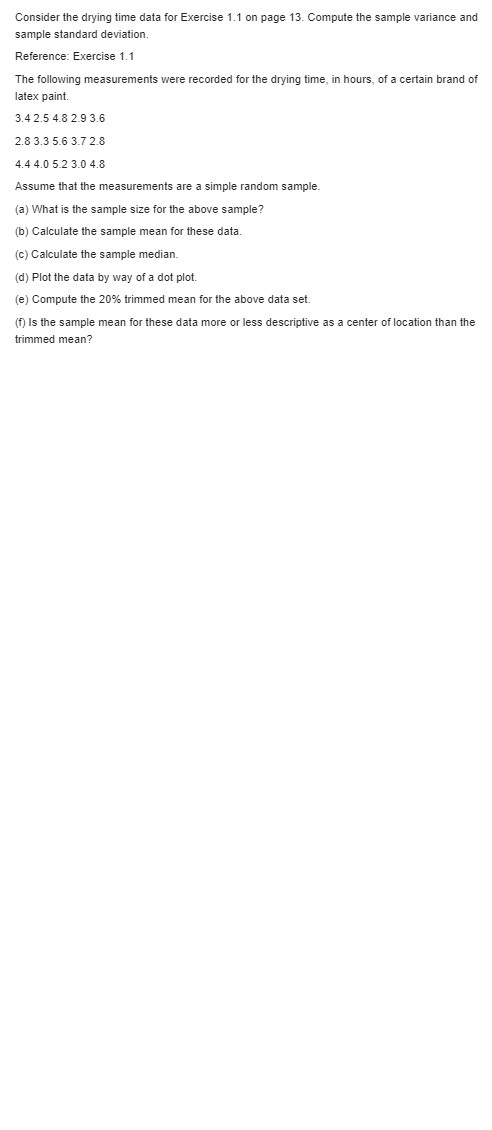
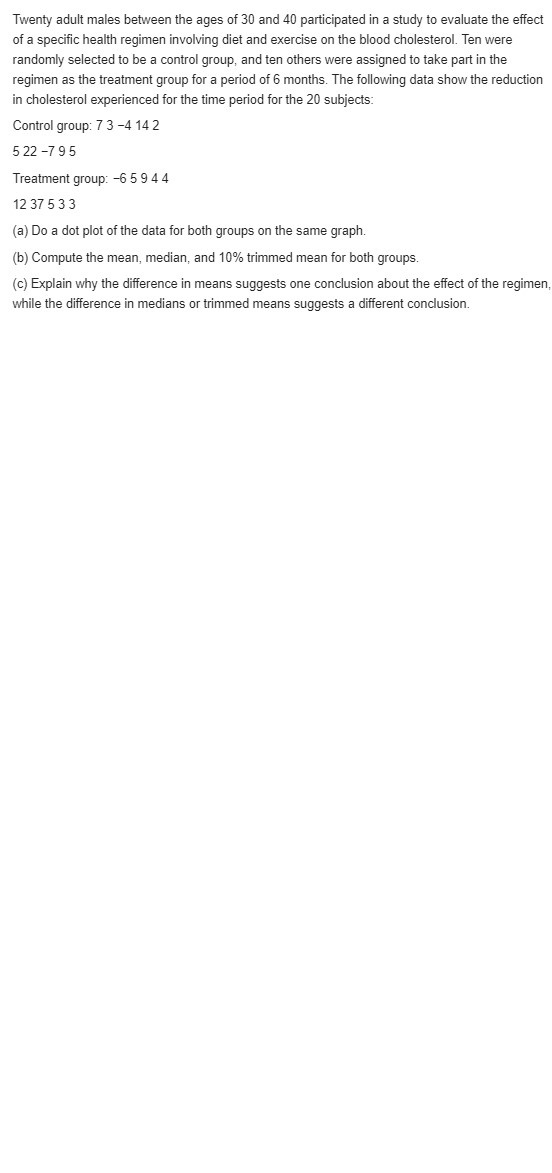
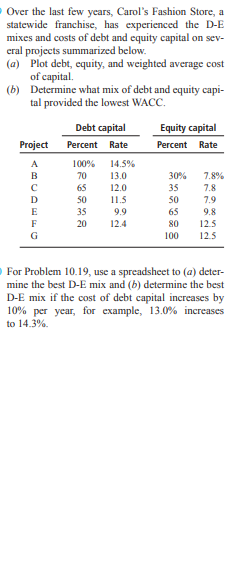
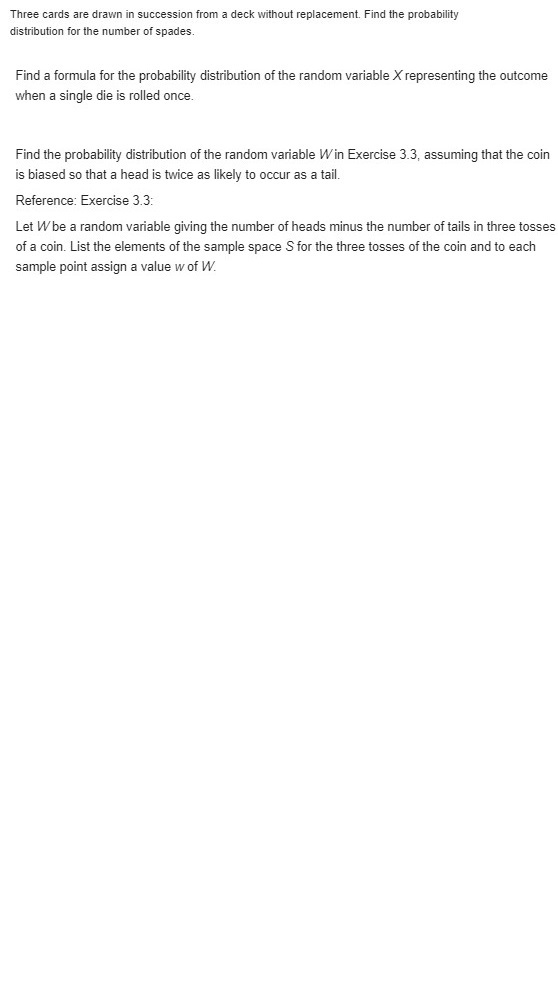
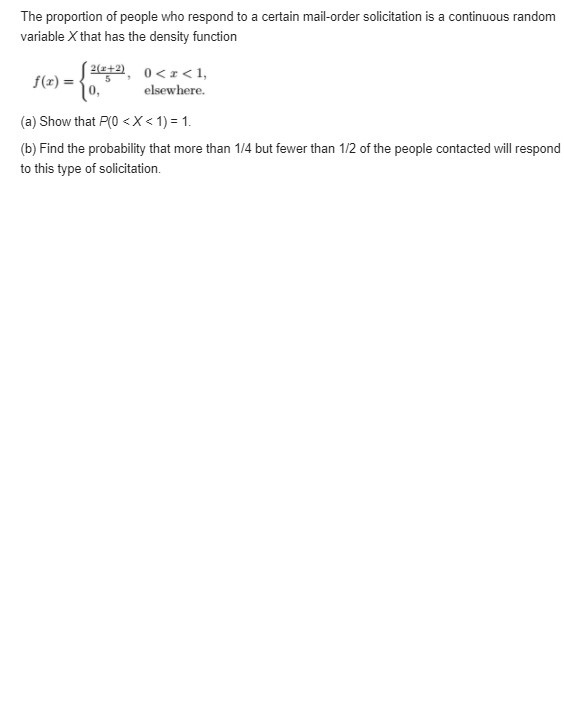
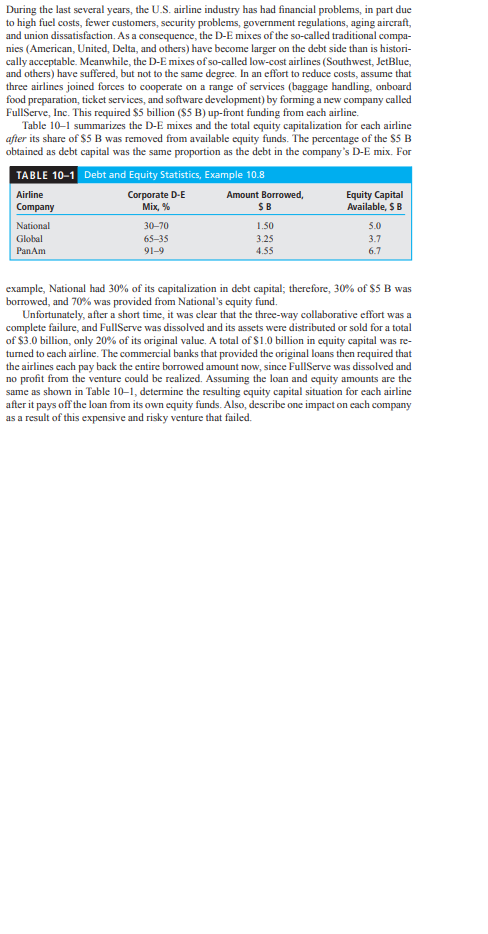
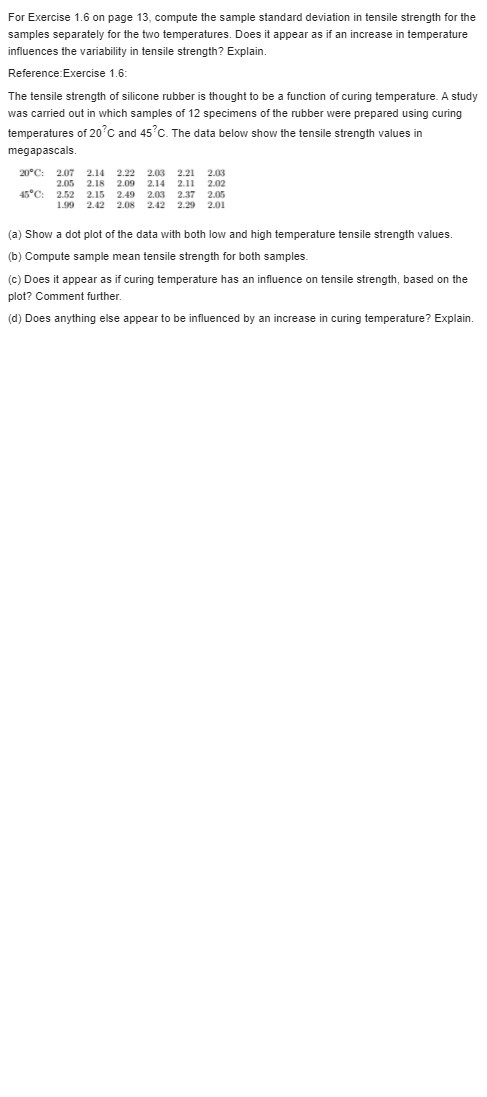
Consider the drying time data for Exercise 1.1 on page 13. Compute the sample variance and sample standard deviation. Reference: Exercise 1.1 The following measurements were recorded for the drying tine. in hours. of a certain brand of latex pa'nt. 3.4 2.5 4.8 2.9 3.6 2.8 3.3 5.5 3.? 2.3 4.4 4.0 5.2 3.0 4.3 Assume that the measurements are a simple random sample. {a} What is the sample size for the above sample? {In} Calculate the sample mean for these data. {c} Calculate the sample median. {djl Plot the data by way of a dot plot. {e} Compute the 20% trirm'ned mean for the above data set. { Is the sample mean for these data more or less descriptive as a center of location than the trimmed mean? Twenty adult males between the ages of 30 and 40 participated in a study to evaluate the effect of a specific health regimen involving diet and exercise on the blood cholesterol. Ten were randomly selected to be a control group, and ten others were assigned to take part in the regimen as the treatment group for a period of 6 months. The following data show the reduction in cholesterol experienced for the time period for the 20 subjects: Control group: 7 3 -4 14 2 522 -795 Treatment group: -6 5 9 4 4 12 37 5 3 3 (a) Do a dot plot of the data for both groups on the same graph. (b) Compute the mean, median, and 10% trimmed mean for both groups. (c) Explain why the difference in means suggests one conclusion about the effect of the regimen while the difference in medians or trimmed means suggests a different conclusion.Over the last few years, Carol's Fashion Store, a statewide franchise, has experienced the D-E mixes and costs of debt and equity capital on sev- eral projects summarized below. (a) Plot debt, equity, and weighted average cost of capital. (b) Determine what mix of debt and equity capi- tal provided the lowest WACC. Debt capital Equity capital Project Percent Rate Percent Rate A 100% 14.5% B 70 13.0 30% 7.8% C 65 12.0 35 7.8 50 11.5 7.9 35 9.9 65 9.8 20 12.4 20 125 100 12 5 For Problem 10.19, use a spreadsheet to (a) deter- mine the best D-E mix and (b) determine the best D-E mix if the cost of debt capital increases by 10% per year, for example, 13.0% increases to 14.3%Three cards are drawn in succession from a deck without replacement. Find the probability distribution for the number of spades. Find a formula for the probability distribution of the random variable X representing the outcome when a single die is rolled once. Find the probability distribution of the random variable Win Exercise 3.3, assuming that the coin is biased so that a head is twice as likely to occur as a tail. Reference: Exercise 3.3: Let Wbe a random variable giving the number of heads minus the number of tails in three tosses of a coin. List the elements of the sample space S for the three tosses of the coin and to each sample point assign a value w of W.The proportion of people who respond to a certain mail-order solicitation is a continuous random variable X that has the density function f(x) = 2(3+2) 0
