Kindly solve urgently need asap
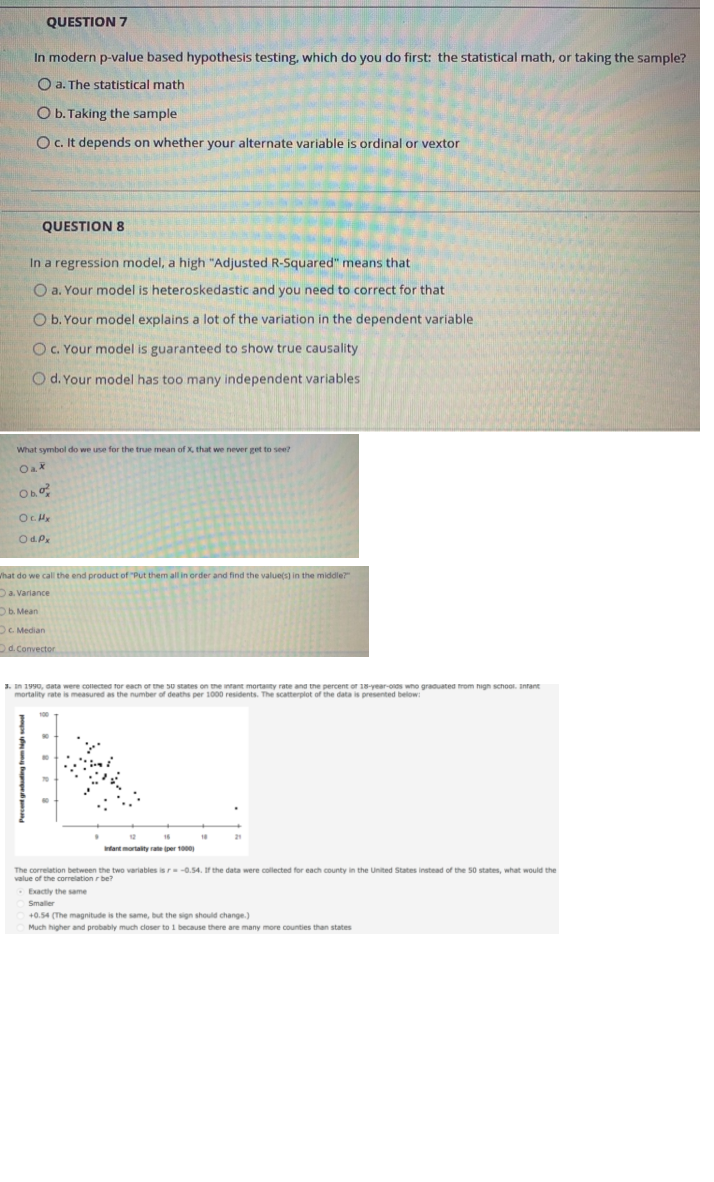
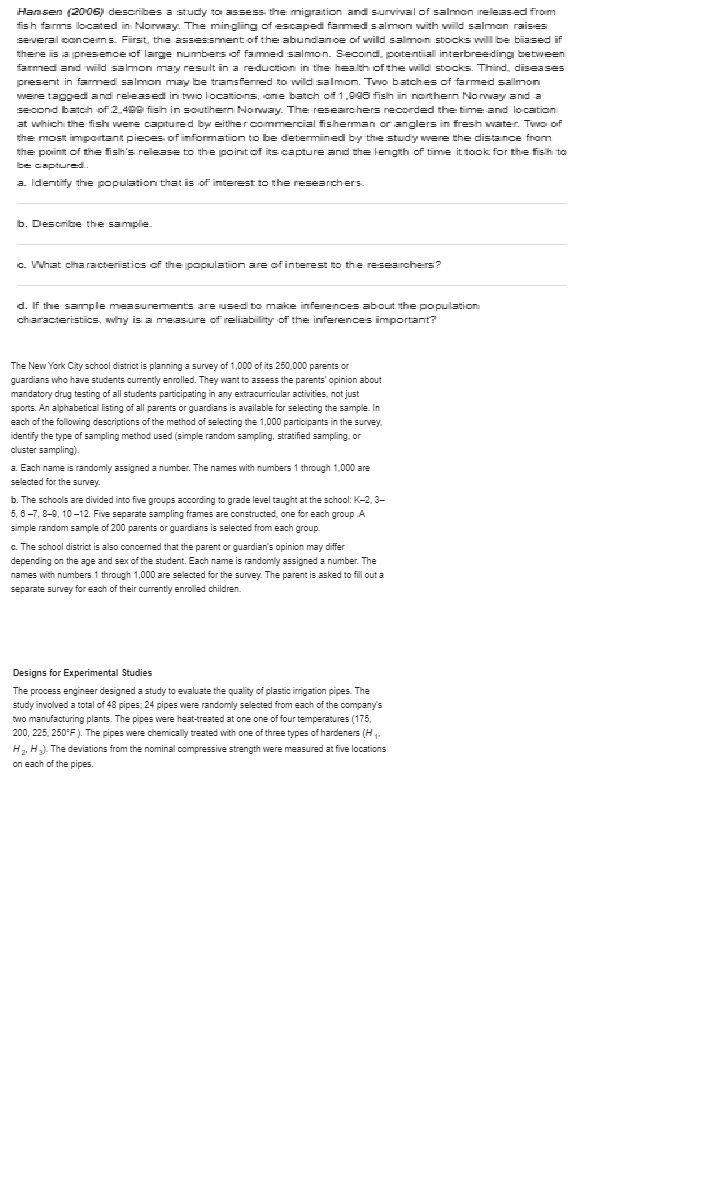
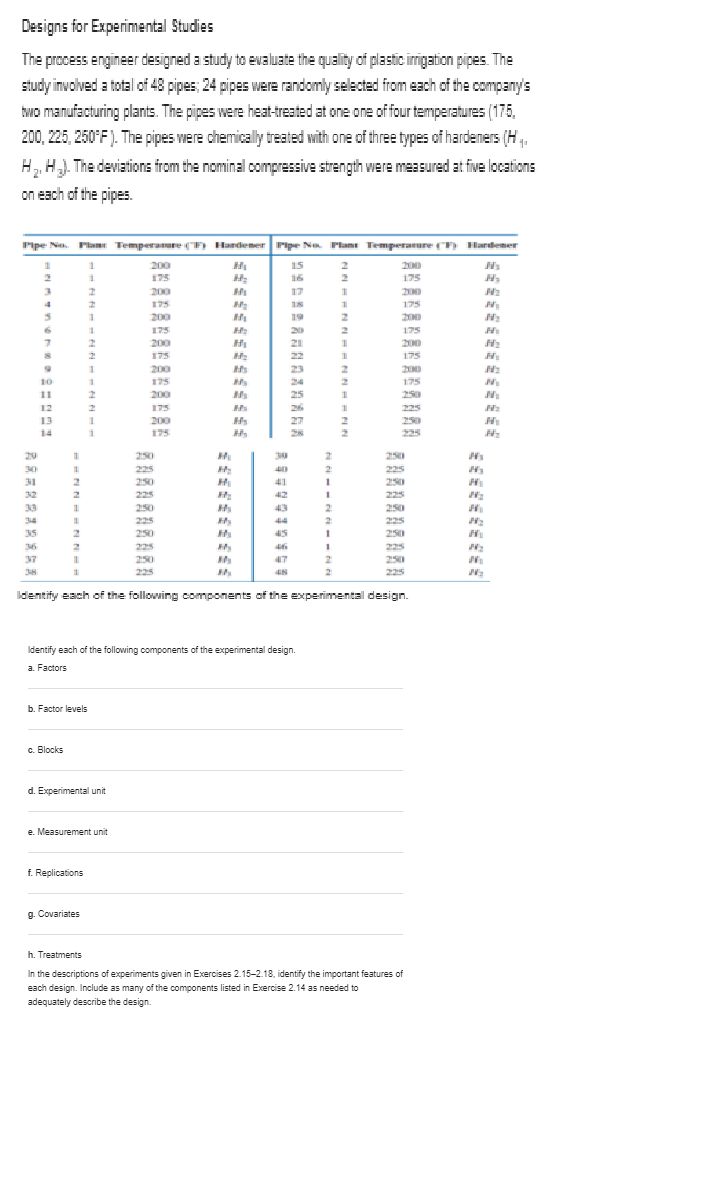
QUESTION 7 In modern p-value based hypothesis testing, which do you do first: the statistical math, or taking the sample? a. The statistical math O b. Taking the sample O c. It depends on whether your alternate variable is ordinal or vextor QUESTION 8 In a regression model, a high "Adjusted R-Squared" means that O a. Your model is heteroskedastic and you need to correct for that O b. Your model explains a lot of the variation in the dependent variable O c. Your model is guaranteed to show true causality O d. Your model has too many independent variables What symbol do we use for the true mean of X, that we never get to see? Oax OCHX OdPx hat do we call the end product of "Put them all in order and find the value(s] in the middle?" a. Variance b. Mean c. Median d. Convector J. In 1y90, data were collected for each of the 50 states on the infant mortality rate and the percent of 18-year-gies who graduated from high school. Infant mortality rate is measured as the number of deaths per 1090 residents. The scatterplot of the data is Infant mortality rate jper 1ooo) The correlation between the two variables is r = -0.54. If the data were collected for each county in the United States instead of the 50 states, what would the value of the correlation r be? Exactly the same Smaller 40.54 (The magnitude is the same, but the sign should change.) Much higher and probably much closer to 1 because there are many more counties than statesHansen (2006) describes a study to assess the migration and survival of salmon released from fish farms located in Norway. The mingling of escaped farmed salmon with wild salmon raises several concei s. First, the assessment of the abundance of wild salmon stocks will be biased if there is 3 presence of large numbers of fanned salmon. Second, potential interbreeding between farmed and wild salmon may result in a reduction in the health of the wild stocks. Thind. diseases present in farmed salmon may be transferred to wild salmon. Two batches of farmed salmon were tagged and released in two locations, one batch of 1.8:90 fish in northern Norway and a second batch of 2 489 fish in southem Norway. The researchers recorded the time and location at which the fish were captured by either commercial fisherman or anglers in fresh water. Two of the most important pieces of information to be determined by the study were the distance from the point of the fish's release to the point of its capture and the length of time it took for the fish to be captured. 3. Identify the population that is of interest to the researchers. b. Describe the sample. c. What characteristics of the population are of interest to the researchers? d. If the sample measurements are used to make inferences about the population characteristics, why is a measure of reliability of the inferences important? The New York City school district is planning a survey of 1,000 of its 250,000 parents or guardians who have students currently enrolled. They want to assess the parents' opinion about mandatory drug testing of all students participating in any extracurricular activities, not just sports. An alphabetical listing of all parents or guardians is available for selecting the sample. In each of the following descriptions of the method of selecting the 1,000 participants in the survey. identify the type of sampling method used (simple random sampling, stratified sampling, or cluster sampling)- a. Each name is randomly assigned a number. The names with numbers 1 through 1,000 are selected for the survey. b. The schools are divided into five groups according to grade level taught at the school: K-2. 3- 5, 6-7, 8-9, 10-12. Five separate sampling frames are constructed, one for each group .A simple random sample of 200 parents or guardians is selected from each group. C. The school district is also concerned that the parent or guardian's opinion may differ depending on the age and sex of the student. Each name is randomly assigned a number. The names with numbers 1 through 1,000 are selected for the survey. The parent is asked to fill out a separate survey for each of their currently enrolled children. Designs for Experimental Studies The process engineer designed a study to evaluate the quality of plastic irrigation pipes. The study involved a total of 48 pipes: 24 pipes were randomly selected from each of the company's two manufacturing plants. The pipes were heat-treated at one one of four temperatures (175, 200, 225, 250*F ). The pipes were chemically treated with one of three types of hardeners (H . H 2. Ha). The deviations from the nominal compressive strength were measured at five locations on each of the pipes.Designs for Experimental Studies The process engineer designed a study to evaluate the quality of plastic irrigation pipes. The study involved a total of 48 pipes; 24 pipes were randomly selected from each of the company's two manufacturing plants. The pipes were heat-treated at one one of four temperatures (175, 200, 225, 250"F ). The pipes were chemically treated with one of three types of hardeners (H . suoneoo enye penseewu even unBuens anissendwoo jeuwou eu: wor Euonewspaul ( H "H on each of the pipes. Pipe No. Plant Temperature (F) Hardener Pipe No. Plant Temperature ( Ty Hardener 200 200 175 175 200 200 175 175 200 19 200 175 175 200 HI 200 175 175 200 175 200 H's 250 225 250 225 250 BENNBENNES 225 2:50 2:25 2:50 250 225 225 Identify each of the following components of the experimental design. Identify each of the following components of the experimental design. a. Factors b. Factor levels C. Blocks d. Experimental unit e. Measurement unit f. Replications g. Covariates h. Treatments In the descriptions of experiments given in Exercises 2.15-2.18, identify the important features of each design. Include as many of the components listed in Exercise 2.14 as needed to adequately describe the design


