Competency III.6 The chief of obstetrics is asking for a six-year trend of vaginal versus cesarean section deliveries. You supply the following graph. Vaginal
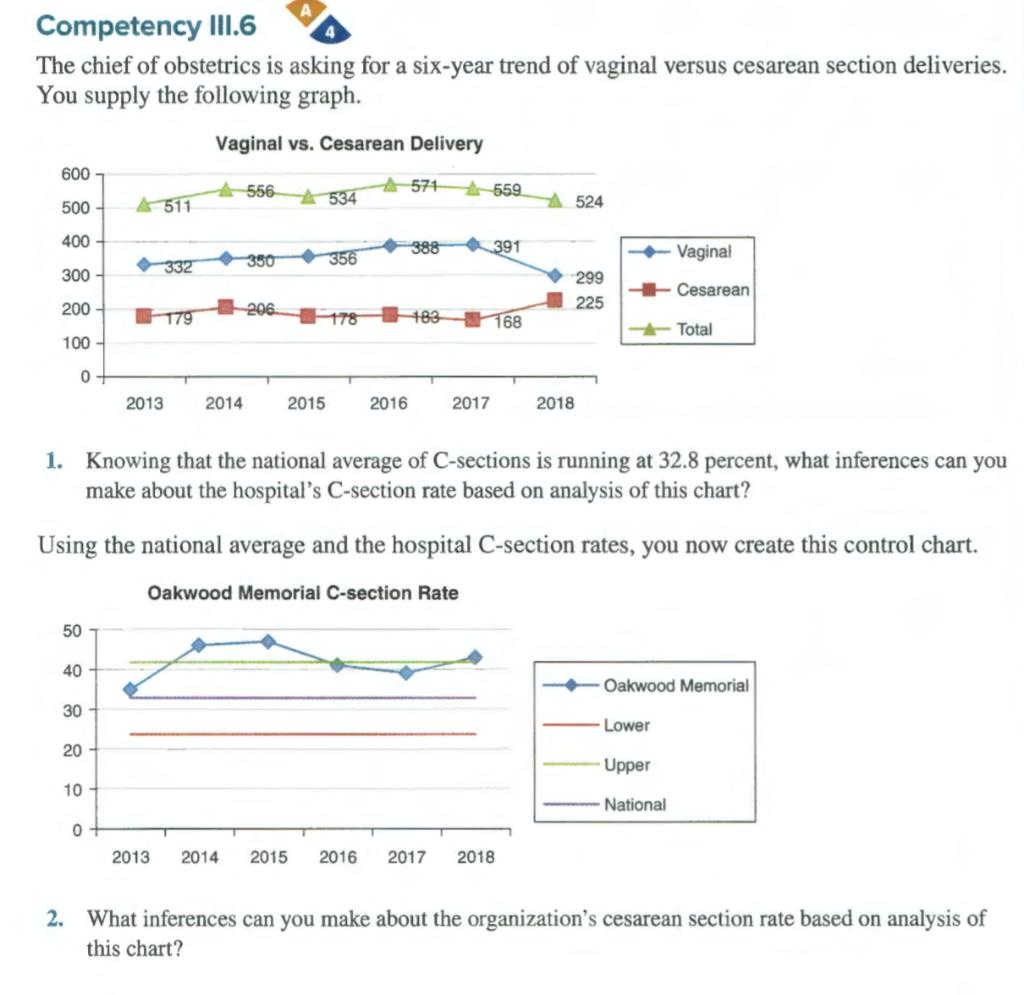
Competency III.6 The chief of obstetrics is asking for a six-year trend of vaginal versus cesarean section deliveries. You supply the following graph. Vaginal vs. Cesarean Delivery 600 556 571 559 534 524 500 511 400 388 391 332 350 356 Vaginal 300 299 225 Cesarean 200 206 179 178 183 168 Total 100 0 2013 2014 2015 2016 2017 2018 1. Knowing that the national average of C-sections is running at 32.8 percent, what inferences can you make about the hospital's C-section rate based on analysis of this chart? Using the national average and the hospital C-section rates, you now create this control chart. Oakwood Memorial C-section Rate 50 40 Oakwood Memorial 30 Lower 20 Upper 10 National 0 2013 2014 2015 2016 2017 2018 2. What inferences can you make about the organization's cesarean section rate based on analysis of this chart? Competency III.6 The chief of obstetrics is asking for a six-year trend of vaginal versus cesarean section deliveries. You supply the following graph. Vaginal vs. Cesarean Delivery 600 556 571 559 534 524 500 511 400 388 391 332 350 356 Vaginal 300 299 225 Cesarean 200 206 179 178 183 168 Total 100 0 2013 2014 2015 2016 2017 2018 1. Knowing that the national average of C-sections is running at 32.8 percent, what inferences can you make about the hospital's C-section rate based on analysis of this chart? Using the national average and the hospital C-section rates, you now create this control chart. Oakwood Memorial C-section Rate 50 40 Oakwood Memorial 30 Lower 20 Upper 10 National 0 2013 2014 2015 2016 2017 2018 2. What inferences can you make about the organization's cesarean section rate based on analysis of this chart?
Step by Step Solution
There are 3 Steps involved in it
Step: 1
Lets go over the questions based on the graph and control chart provided for Vaginal vs Cesarean Delivery at Oakwood Memorial Hospital over a sixyear ...
See step-by-step solutions with expert insights and AI powered tools for academic success
Step: 2

Step: 3
Ace Your Homework with AI
Get the answers you need in no time with our AI-driven, step-by-step assistance
Get Started