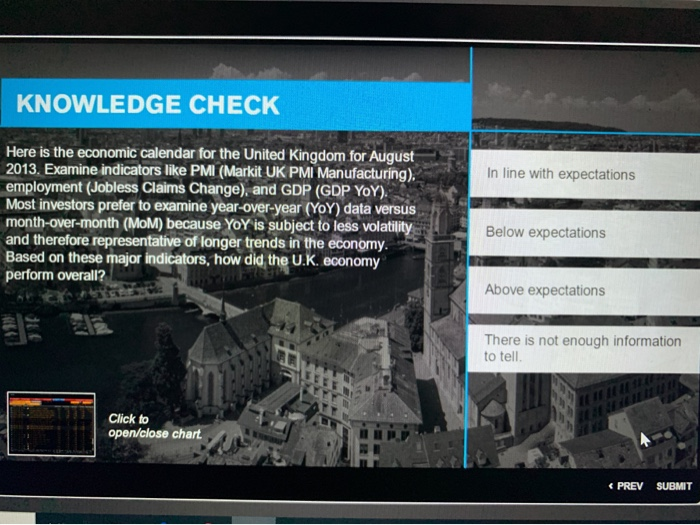
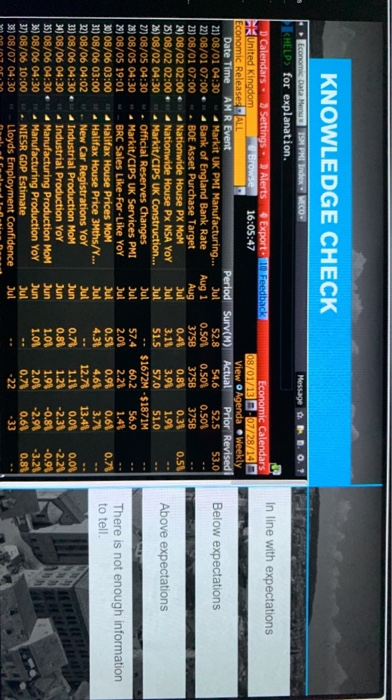
KNOWLEDGE CHECK In line with expectations Here is the economic calendar for the United Kingdom for August 2013. Examine indicators like PMI (Markit UK PMI Manufacturing), employment (Jobless Claims Change), and GDP (GDP YOY). Most investors prefer to examine year-over-year (YoY) data versus month-over-month (MoM) because YoY is subject to less volatility and therefore representative of longer trends in the economy. Based on these major indicators, how did the U.K. economy perform overall? Below expectations Above expectations There is not enough information to tell Click to open/close chart for explanation. Calendars > Settings Alerts Export Feedback United Kingdom Browse 16:05:47 Economic Releases ALL Date Time AM R Event Period Surv(M) 21) 08/01 04:30 Markit UK PMI Manufacturing... 52.8 22) 08/01 07:00 - Bank of England Bank Rate 0.501 23) 08/01 07:00 . BOE Asset Purchase Target Aug 375B 24) 08/02 02:00 Nationwide House PX MOM Jul 0.41 25) 08/02 02:00 Nationwide House Px NSA YOY Jul 3.11 26) 08/02 04:30 . Markit/CIPS UK Construction... Jul 51.5 27) 08/05 04:30 . Official Reserves Changes Jul 28) 08/05 04:30 - Markit/CIPS UK Services PMI Jul 57.4 29) 08/05 19:01 - BRC Sales Like-For-Like YoY Jul 2.01 30) 08/06 03:00 Halifax House Prices MOM Jul 0.51 31) 08/06 03:00 Halifax House Price 3Mths/Y... Jul 4.31 32) 08/06 04:02 - New Car Registrations YoY Jul 33) 08/06 04:30 Industrial Production MOM Jun 0.7 34) 08/06 04:30 1. Industrial Production YoY Jun 0.84 35) 08/06 04:30 - Manufacturing Production MOM Jun 1.01 35) 08/06 04:30 Manufacturing Production YoY Jun 1.01 37) 08/06 10:00 . NIESR GDP Estimate Jul 38) 08/07 04:30 Lloyds Employment Confidence Jul Above expectations Economic Calendars 08/01/13 - 07/28/100 View Agenda Weekly Actual Prior Revised 54.6 52.5 53.0 0.501 0.501 3758 375B 0.81 0.31 0.50 3.91 1.96 57.0 51.0 $1672M -$1871M 60.2 56.9 2.21 1.41 0.91 0.61 0.75 4.61 3.7 12.7 13.41 1.11 0.01 0.01 1.24 -2.31 -2.21 1.94 -0.81 -0.91 2.01 -2.91 -3.21 0.7 0.61 0.81 -22 -33 There is not enough information to tell