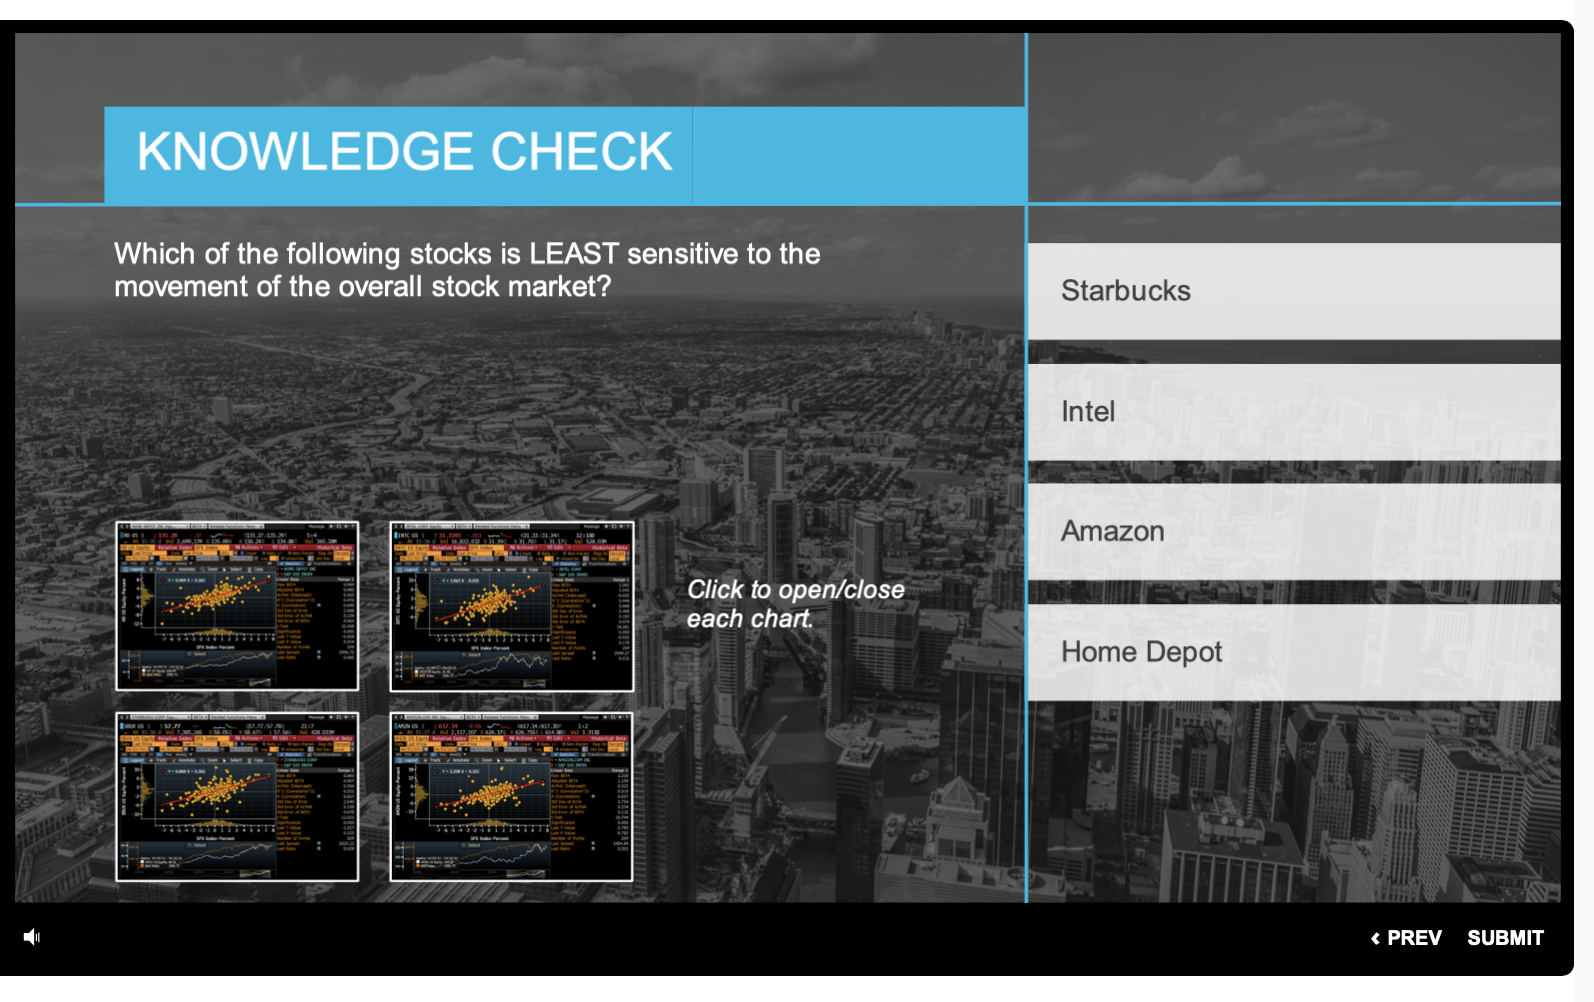
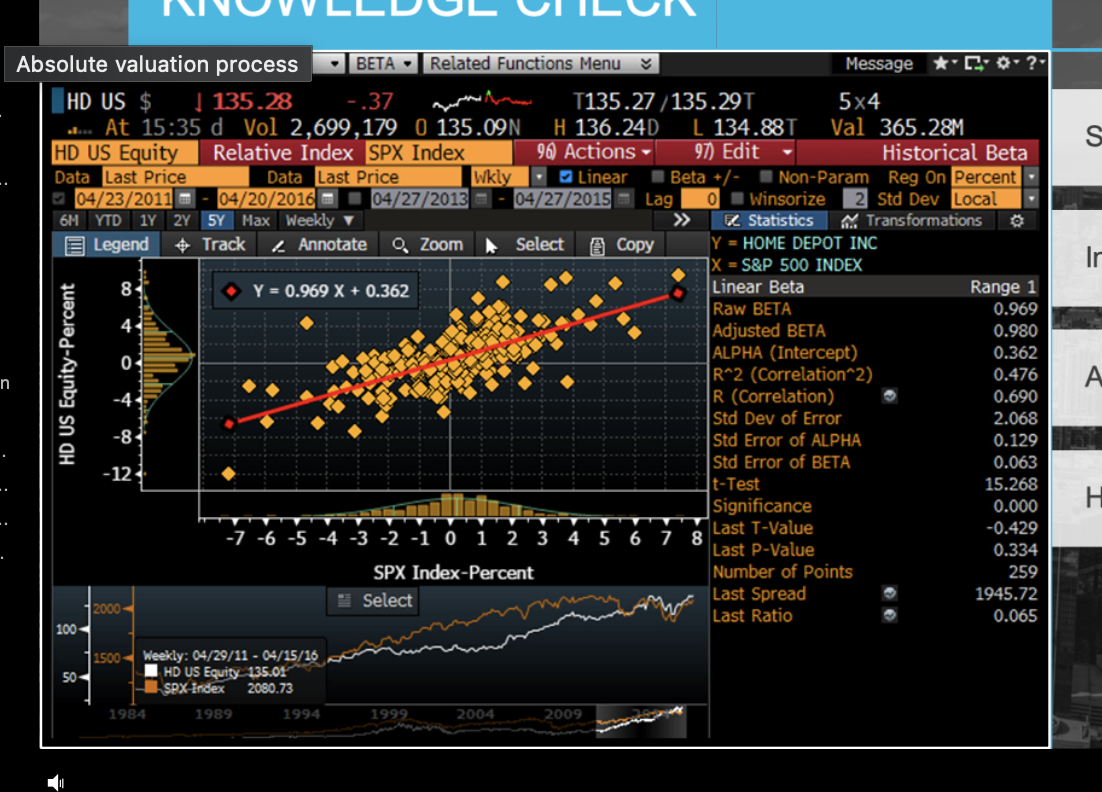
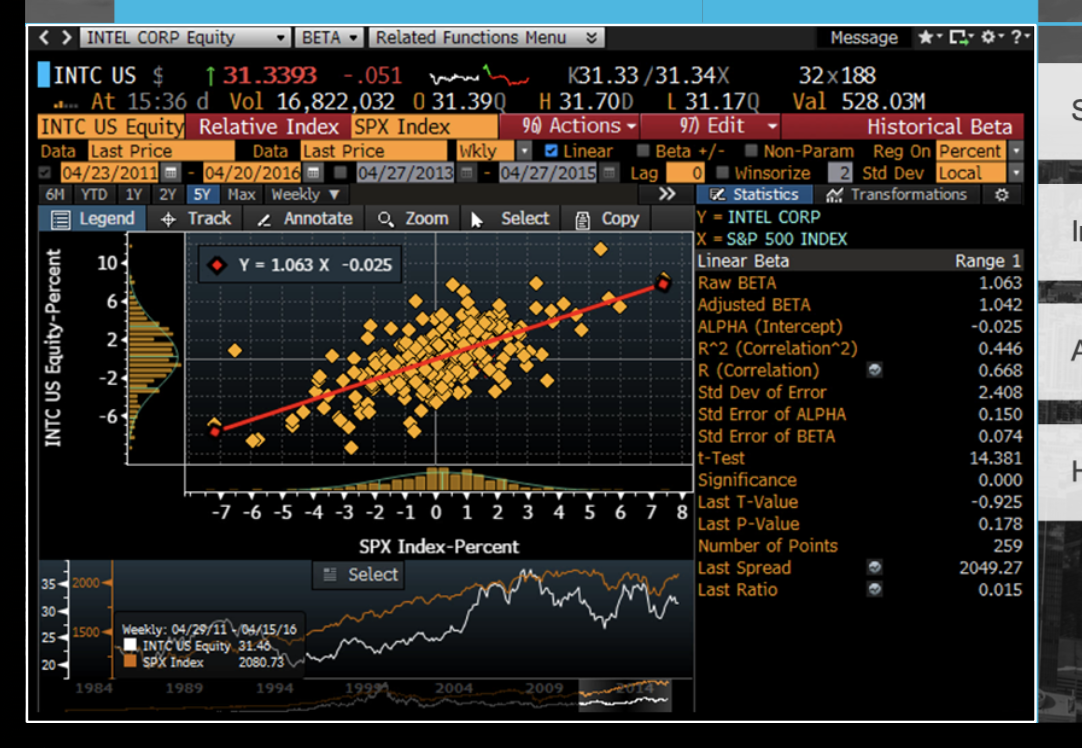
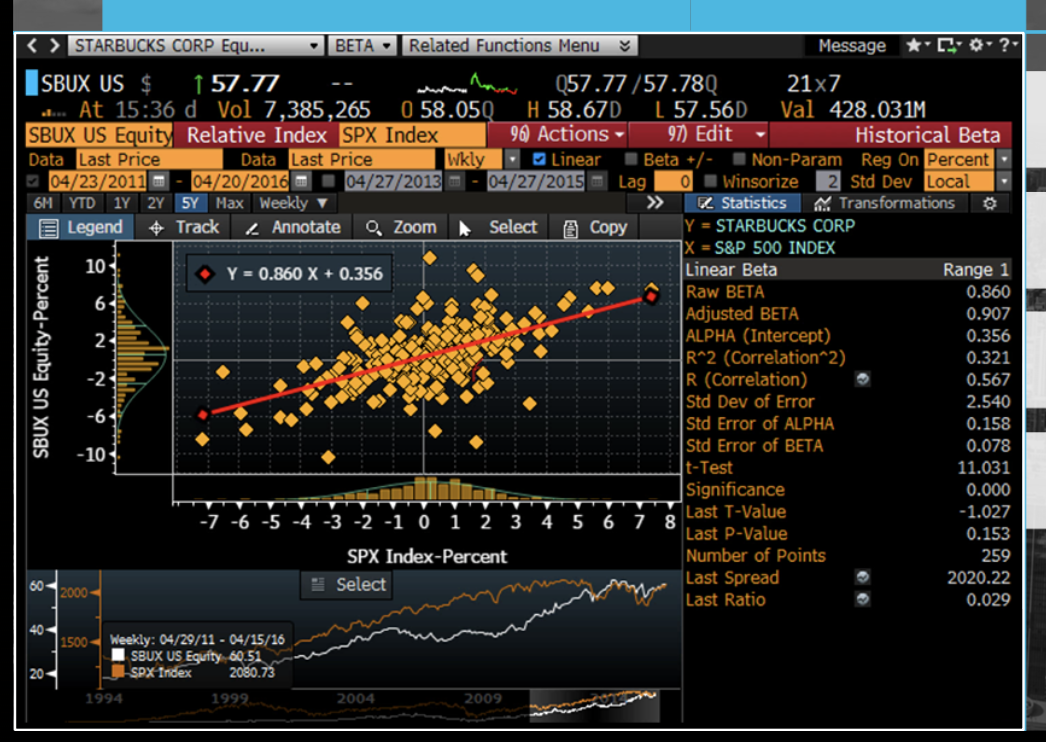
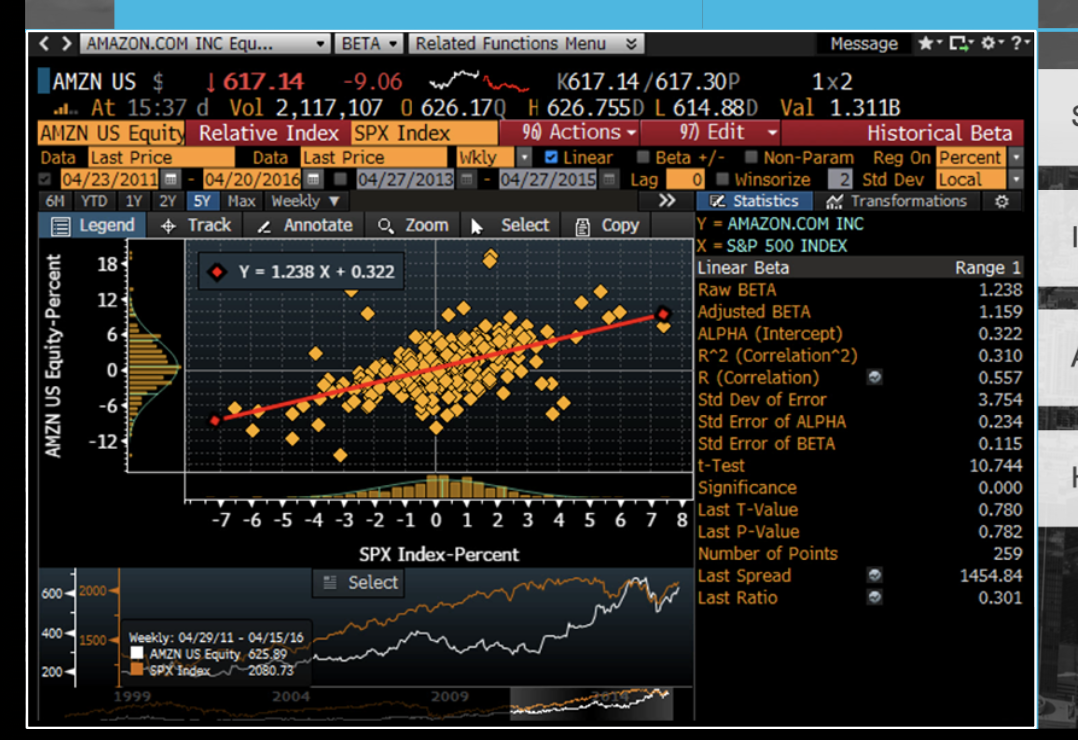
KNOWLEDGE CHECK Which of the following stocks is LEAST sensitive to the movement of the overall stock market? Starbucks Intel Amazon Click to open/close each chart. Home Depot > Statistics . Transformations E Legend # Track Annotate O, Zoom Select Copy Y = HOME DEPOT INC |X = S&P 500 INDEX 8 Y = 0.969 X + 0.362 Linear Beta Range 1 Raw BETA 0.969 4. Adjusted BETA 0.980 ALPHA (Intercept) 0.362 0 n R^2 (Correlation^2) 0.476 -4 R (Correlation) 0.690 Std Dev of Error 2.068 -8. Std Error of ALPHA 0.129 Error of BETA 0.063 -12 t-Test 15.268 Significance 0.000 -7 -6 -5 -4 -3 -2 -1 0 1 2 3 4 5 6 7 8 Last T-Value -0.429 Last P-value 0.334 SPX Index-Percent Number of Points 259 Select Last Spread 1945.72 2000- Last Ratio 0.065 HD US Equity-Percent A 100 50 1500 Weekly: 04/29/11 - 04/15/16 HD US Equity 135.0 SPX Endex 2080.73 1984 1989 1994 1999 2004 2009 INTEL CORP Equity BETA Related Functions Menu Message INTC US $ 131.3393 .051 K31.33 31.34X 32 x 188 ... At 15:36 d Vol 16,822,032 031.390 H 31.70D L 31.17Q Val 528.03M INTC US Equity Relative Index SPX Index 96 Actions 97) Edit Historical Beta Data Last Price Data Last Price Wkly Linear Beta +/- Non-Param Reg on Percent 04/23/2011 - - 04/20/2016 - 04/27/2013 04/27/2015 Lag 0 Winsorize 2 Std Dev Local 6M YTD 1Y 2Y 5Y Max Weekly v Statistics Transformations E Legend Track Annotate O, Zoom Select Copy Y = INTEL CORP 1X = S&P 500 INDEX 10 Y = 1.063 X -0.025 Linear Beta Range 1 Raw BETA 1.063 6 Adjusted BETA 1.042 ALPHA (Intercept) -0.025 R^2 (Correlation^2) 0.446 R (Correlation) 0.668 Std Dev of Error 2.408 Std Error of ALPHA 0.150 Std Error of BETA 0.074 t-Test 14.381 Significance 0.000 -7 -6 -5 -4 -3 -2 -1 0 1 2 3 Last T-Value -0.925 4 5 6 7 8 Last P-value 0.178 SPX Index-Percent Number of Points 259 - Select Last Spread 2049.27 35 2000 Last Ratio 0.015 30 25 1500- Weekly: 04/29/11 - 05/15/16 INTC US Equity 31.46 20 Sex Index 2080.73 1984 1989 1994 2004 2009 INTC US Equity-Percent A STARBUCKS CORP Equ... BETA -Related Functions Menu Message *C ? ISBUX US $ 1 57.7 057.77 /57.78Q 21x7 ..... At 15:36 d Vol 7,385,265 0 58.05Q H 58.67D [ 57.56D Val 428.031M SBUX US Equity Relative Index SPX Index 96) Actions - 97) Edit Historical Beta Data Last Price Data Last Price Wkly Linear Beta +/- Non-Param Reg on Percent 04/23/2011 - 04/20/2016 - 04/27/2013 04/27/2015 Lag O Winsorize 2 Std Dev Local 6M YTD 1Y 2Y 5 Max Weekly Statistics Transformations E Legend + Track Annotate O, Zoom Select * Copy Y = STARBUCKS CORP |X = S&P 500 INDEX 10 Y = 0.860 X + 0.356 Linear Beta Range 1 6. Raw BETA 0.860 Adjusted BETA 0.907 2 ALPHA (Intercept) 0.356 R^2 (Correlation^2) 0.321 -2 R (Correlation) 0.567 Std Dev of Error Std Error of ALPHA 0.158 -10 Std Error of BETA 0.078 t-Test 11.031 Significance 0.000 -7 -6 -5 -4 -3 -2 -1 0 1 2 3 4 5 6 7 8 Last T-Value -1.027 Last P-value 0.153 SPX Index-Percent Number of Points 259 60 Select Last Spread 2020.22 2000- Last Ratio 0.029 40- 1500 Weekly: 04/29/11 - 04/15/16 SBUX US Equity 60.51 SPX Index 2080.73 1994 1999, 2004 2009 SBUX US Equity-Percent 2.540 20. 1.238 AMAZON.COM INC Equ... BETA -Related Functions Menu Message * * ? AMZN US $ 1 617.14 -9.06 K617.14/617.30P 1x2 al.. At 15:37 d Vol 2,117,107 0 626.170 H 626.755D L 614.88D Val 1.311B AMZN US Equity Relative Index SPX Index 90 Actions 97) Edit Historical Beta Data Last Price Data Last Price Wkly Linear Beta +/- Non-Param Reg on Percent : 04/23/2011 04/20/2016 04/27/2013 - 04/27/2015 Lag O Winsorize 2 Std Dev Local 6M YTD 1Y 2Y 5Y Max Weekly v Statistics Transformations E Legend Track Annotate O, Zoom Select Copy Y = AMAZON.COM INC |X = S&P 500 INDEX 18 Y = 1.238 X + 0.322 Linear Beta Range 1 12 Raw BETA Adjusted BETA 1.159 61 ALPHA (Intercept) 0.322 R^2 (Correlation^2) 0.310 0 R (Correlation) 0.557 -6 Std Dev of Error 3.754 Std Error of ALPHA 0.234 -12 Std Error of BETA 0.115 t-Test 10.744 Significance 0.000 -7 -6 -5 -4 -3 -2 -1 0 1 2 3 4 5 6 7 8 Last T-Value 0.780 Last p-value 0.782 SPX Index-Percent Number of Points 259 Select Last Spread 1454.84 600 2000- Last Ratio 0.301 AMZN US Equity-Percent 400 200 1500 Weekly: 04/29/11 - 04/15/16 AMZN US Equity 625.89 SPX Index 2030.73 1999 2004 2009 KNOWLEDGE CHECK Which of the following stocks is LEAST sensitive to the movement of the overall stock market? Starbucks Intel Amazon Click to open/close each chart. Home Depot > Statistics . Transformations E Legend # Track Annotate O, Zoom Select Copy Y = HOME DEPOT INC |X = S&P 500 INDEX 8 Y = 0.969 X + 0.362 Linear Beta Range 1 Raw BETA 0.969 4. Adjusted BETA 0.980 ALPHA (Intercept) 0.362 0 n R^2 (Correlation^2) 0.476 -4 R (Correlation) 0.690 Std Dev of Error 2.068 -8. Std Error of ALPHA 0.129 Error of BETA 0.063 -12 t-Test 15.268 Significance 0.000 -7 -6 -5 -4 -3 -2 -1 0 1 2 3 4 5 6 7 8 Last T-Value -0.429 Last P-value 0.334 SPX Index-Percent Number of Points 259 Select Last Spread 1945.72 2000- Last Ratio 0.065 HD US Equity-Percent A 100 50 1500 Weekly: 04/29/11 - 04/15/16 HD US Equity 135.0 SPX Endex 2080.73 1984 1989 1994 1999 2004 2009 INTEL CORP Equity BETA Related Functions Menu Message INTC US $ 131.3393 .051 K31.33 31.34X 32 x 188 ... At 15:36 d Vol 16,822,032 031.390 H 31.70D L 31.17Q Val 528.03M INTC US Equity Relative Index SPX Index 96 Actions 97) Edit Historical Beta Data Last Price Data Last Price Wkly Linear Beta +/- Non-Param Reg on Percent 04/23/2011 - - 04/20/2016 - 04/27/2013 04/27/2015 Lag 0 Winsorize 2 Std Dev Local 6M YTD 1Y 2Y 5Y Max Weekly v Statistics Transformations E Legend Track Annotate O, Zoom Select Copy Y = INTEL CORP 1X = S&P 500 INDEX 10 Y = 1.063 X -0.025 Linear Beta Range 1 Raw BETA 1.063 6 Adjusted BETA 1.042 ALPHA (Intercept) -0.025 R^2 (Correlation^2) 0.446 R (Correlation) 0.668 Std Dev of Error 2.408 Std Error of ALPHA 0.150 Std Error of BETA 0.074 t-Test 14.381 Significance 0.000 -7 -6 -5 -4 -3 -2 -1 0 1 2 3 Last T-Value -0.925 4 5 6 7 8 Last P-value 0.178 SPX Index-Percent Number of Points 259 - Select Last Spread 2049.27 35 2000 Last Ratio 0.015 30 25 1500- Weekly: 04/29/11 - 05/15/16 INTC US Equity 31.46 20 Sex Index 2080.73 1984 1989 1994 2004 2009 INTC US Equity-Percent A STARBUCKS CORP Equ... BETA -Related Functions Menu Message *C ? ISBUX US $ 1 57.7 057.77 /57.78Q 21x7 ..... At 15:36 d Vol 7,385,265 0 58.05Q H 58.67D [ 57.56D Val 428.031M SBUX US Equity Relative Index SPX Index 96) Actions - 97) Edit Historical Beta Data Last Price Data Last Price Wkly Linear Beta +/- Non-Param Reg on Percent 04/23/2011 - 04/20/2016 - 04/27/2013 04/27/2015 Lag O Winsorize 2 Std Dev Local 6M YTD 1Y 2Y 5 Max Weekly Statistics Transformations E Legend + Track Annotate O, Zoom Select * Copy Y = STARBUCKS CORP |X = S&P 500 INDEX 10 Y = 0.860 X + 0.356 Linear Beta Range 1 6. Raw BETA 0.860 Adjusted BETA 0.907 2 ALPHA (Intercept) 0.356 R^2 (Correlation^2) 0.321 -2 R (Correlation) 0.567 Std Dev of Error Std Error of ALPHA 0.158 -10 Std Error of BETA 0.078 t-Test 11.031 Significance 0.000 -7 -6 -5 -4 -3 -2 -1 0 1 2 3 4 5 6 7 8 Last T-Value -1.027 Last P-value 0.153 SPX Index-Percent Number of Points 259 60 Select Last Spread 2020.22 2000- Last Ratio 0.029 40- 1500 Weekly: 04/29/11 - 04/15/16 SBUX US Equity 60.51 SPX Index 2080.73 1994 1999, 2004 2009 SBUX US Equity-Percent 2.540 20. 1.238 AMAZON.COM INC Equ... BETA -Related Functions Menu Message * * ? AMZN US $ 1 617.14 -9.06 K617.14/617.30P 1x2 al.. At 15:37 d Vol 2,117,107 0 626.170 H 626.755D L 614.88D Val 1.311B AMZN US Equity Relative Index SPX Index 90 Actions 97) Edit Historical Beta Data Last Price Data Last Price Wkly Linear Beta +/- Non-Param Reg on Percent : 04/23/2011 04/20/2016 04/27/2013 - 04/27/2015 Lag O Winsorize 2 Std Dev Local 6M YTD 1Y 2Y 5Y Max Weekly v Statistics Transformations E Legend Track Annotate O, Zoom Select Copy Y = AMAZON.COM INC |X = S&P 500 INDEX 18 Y = 1.238 X + 0.322 Linear Beta Range 1 12 Raw BETA Adjusted BETA 1.159 61 ALPHA (Intercept) 0.322 R^2 (Correlation^2) 0.310 0 R (Correlation) 0.557 -6 Std Dev of Error 3.754 Std Error of ALPHA 0.234 -12 Std Error of BETA 0.115 t-Test 10.744 Significance 0.000 -7 -6 -5 -4 -3 -2 -1 0 1 2 3 4 5 6 7 8 Last T-Value 0.780 Last p-value 0.782 SPX Index-Percent Number of Points 259 Select Last Spread 1454.84 600 2000- Last Ratio 0.301 AMZN US Equity-Percent 400 200 1500 Weekly: 04/29/11 - 04/15/16 AMZN US Equity 625.89 SPX Index 2030.73 1999 2004 2009