Answered step by step
Verified Expert Solution
Link Copied!

Question

1 Approved Answer

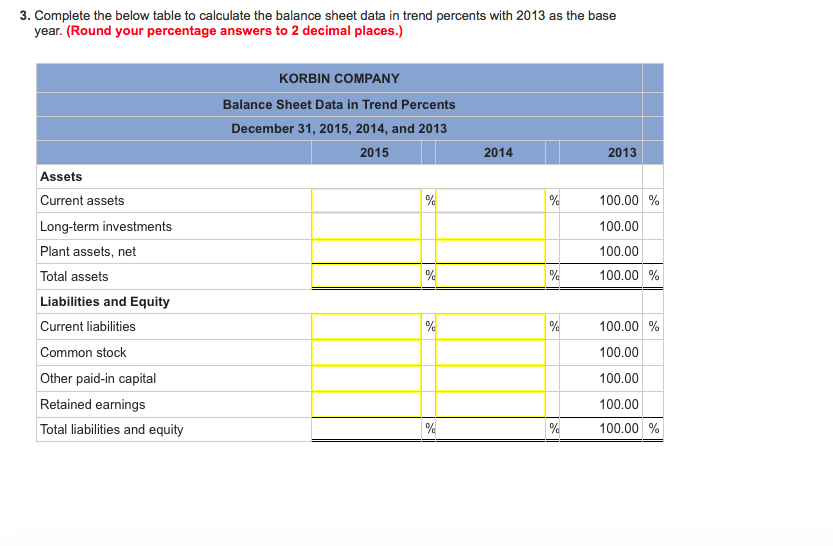
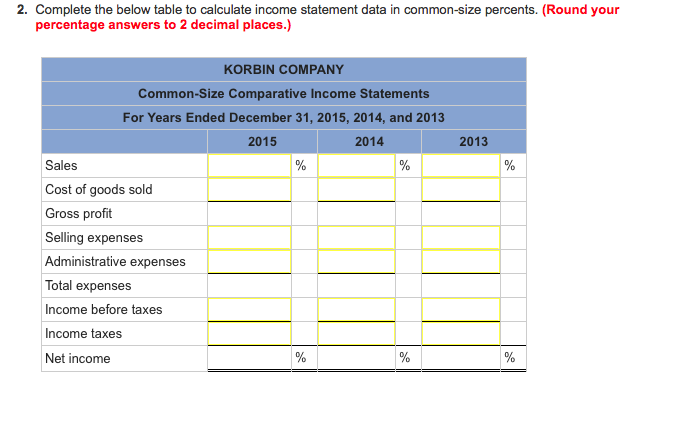
KORBIN COMPANY Comparative Income Statements For Years Ended December 31, 2015, 2014, and 2013 2015 2014 2013 450.123 344,831 239,300 Sales 153152 Cost of goods
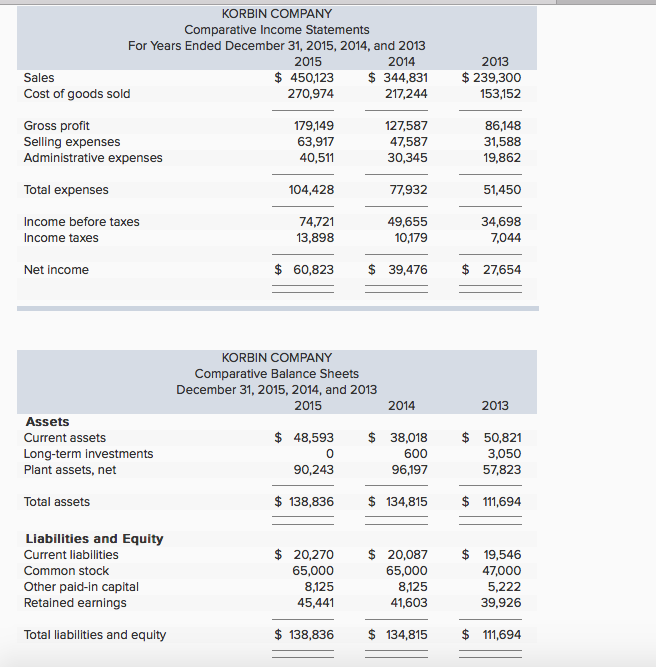
image text in transcribedimage text in transcribedimage text in transcribedimage text in transcribed

KORBIN COMPANY Comparative Income Statements For Years Ended December 31, 2015, 2014, and 2013 2015 2014 2013 450.123 344,831 239,300 Sales 153152 Cost of goods sold 270,974 217,244 179149 Gross profit 127,587 86148 Selling expenses 31,588 63.917 47587 Administrative expenses 40,511 30,345 19,862 Total expenses 104,428 77,932 51,450 Income before taxes Income taxes 60,823 39,476 27,654 Net income KORBIN COMPANY Comparative Balance Sheets December 31, 2015, 2014, and 2013 2015 2014 2013 Assets 48,593 38,018 50,821 Current assets Long-term investments 600 3.050 96.197 57,823 Plant assets, net 90,243 138836 s 134815 s m694 Total assets Liabilities and Equity 20,270 20,087 19,546 Current liabilities 65,000 65,000 Common stock 47,000 Other paid-in capital 8.125 8.125 5.222 45,441 39,926 Retained earnings 41.603 138836 13485 11694 Total liabilities and equity
Step by Step Solution

There are 3 Steps involved in it

Step: 1

blur-text-image

Get Instant Access to Expert-Tailored Solutions

See step-by-step solutions with expert insights and AI powered tools for academic success

Step: 2

blur-text-image_2

Step: 3

blur-text-image_3

Ace Your Homework with AI

Get the answers you need in no time with our AI-driven, step-by-step assistance

Get Started

Recommended Textbook for

Students also viewed these Accounting questions

Question

D How will your group react to this revelation?

Answered: 1 week ago