Answered step by step
Verified Expert Solution
Link Copied!

Question

1 Approved Answer

_l 1. Use Least-Squares to t a straight line, 3! = ax + b, to the data. Plot the data and the line. Calculate Rzand
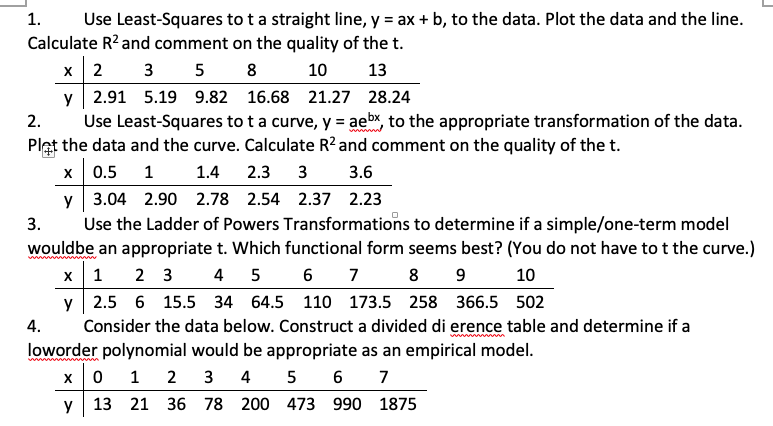
image text in transcribed
_l 1. Use Least-Squares to t a straight line, 3! = ax + b, to the data. Plot the data and the line. Calculate Rzand comment on the quality of the t. x 2 3 5 3 19 13 yr 2.91 5.19 9.32 19.63 21.2? 23.24 2. Use Least-Squares to t a cu rue, v = egg; to the appropriate transformation of the data. Pl\" the data and the curve. Calculate Rzand comment on the quality of the t. x 9.5 1 1.4 2.3 3 3.6 yr 3.94 2.99| 2.?3 2.54 2.3?r 2.23 3. Use the Ladder of Powers Transformatio'i'ls to determine if a simplefone-term model wouldbe an appropriate t. Which functional form seems best? (You do not have to t the cu rue.) 11123455? 39 19 yr 2.5 E 15.5 34 34.5 119 123.5 253 399.5 592 4. Consider the data below. Construct a divided di erence table and determine if a loworder polynomial would be appropriate as an empirical model. x912345E? y 13 21 3E 23 299 423 999 1325

Step by Step Solution

There are 3 Steps involved in it

Step: 1

blur-text-image

Get Instant Access to Expert-Tailored Solutions

See step-by-step solutions with expert insights and AI powered tools for academic success

Step: 2

blur-text-image

Step: 3

blur-text-image

Ace Your Homework with AI

Get the answers you need in no time with our AI-driven, step-by-step assistance

Get Started

Recommended Textbook for

A First Course in General Relativity

Authors: Bernard Schutz

2nd edition

521887054, 978-0521887052

More Books

Students also viewed these Mathematics questions