L 2 Miscellaneous line item 3 Professional services expense Property, plant and equipment 5 Rental expense 5 Repairs and maintenance expense Supplies expense B

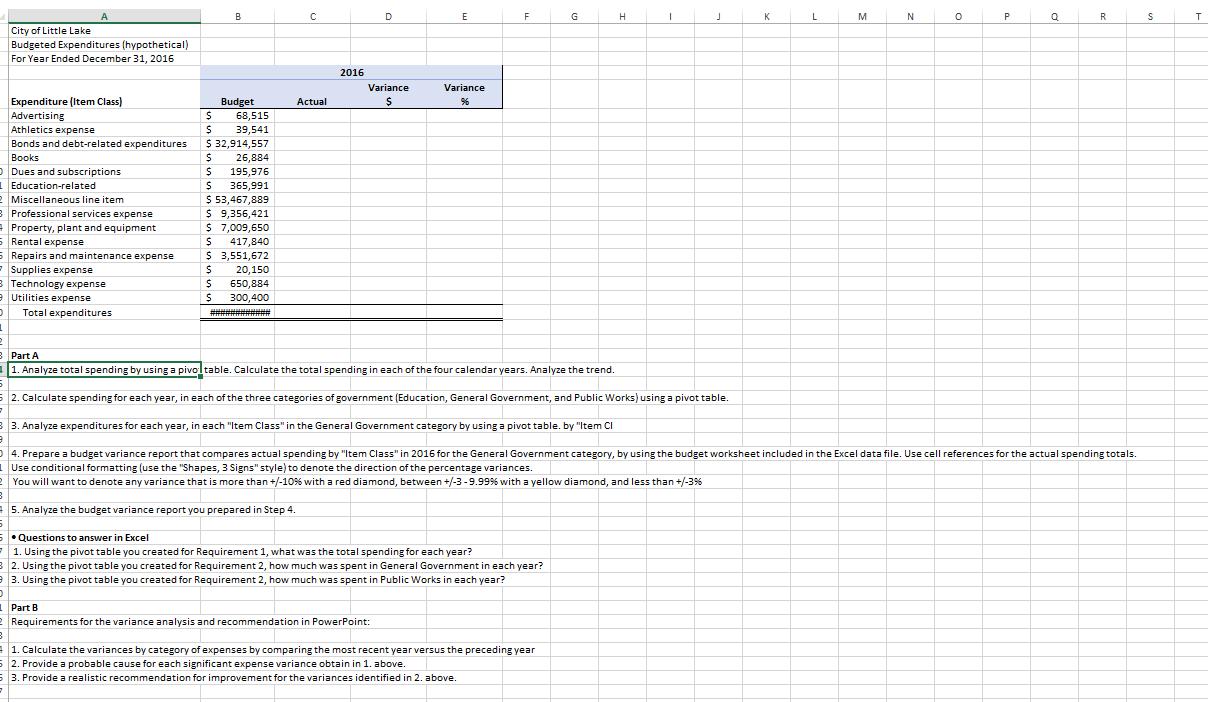
L 2 Miscellaneous line item 3 Professional services expense Property, plant and equipment 5 Rental expense 5 Repairs and maintenance expense Supplies expense B Technology expense e Utilities expense O 3 5 City of Little Lake Budgeted Expenditures (hypothetical) For Year Ended December 31, 2016 2 Expenditure (Item Class) Advertising Athletics expense Bonds and debt-related expenditures Books Dues and subscriptions Education-related Total expenditures B Budget 68,515 $ $ 39,541 $ 32,914,557 $ 26,884 195,976 $ $ 365,991 $ 53,467,889 $ 9,356,421 $7,009,650 $ 417,840 $ 3,551,672 $ $ S 20,150 650,884 300,400 Actual 2016 D Variance $ E Variance % F Part A 1. Analyze total spending by using a pivoltable. Calculate the total spending in each of the four calendar years. Analyze the trend. Part B 2 Requirements for the variance analysis and recommendation in PowerPoint: B G 33. Analyze expenditures for each year, in each "Item Class" in the General Government category by using a pivot table. by "Item Cl 9 B 45. Analyze the budget variance report you prepared in Step 4. 5 5 Questions to answer in Excel 71. Using the pivot table you created for Requirement 1, what was the total spending for each year? 3 2. Using the pivot table you created for Requirement 2, how much was spent in General Government in each year? 93. Using the pivot table you created for Requirement 2, how much was spent in Public Works in each year? ) 2. Calculate spending for each year, in each of the three categories of government (Education, General Government, and Public Works) using a pivot table. H 41. Calculate the variances by category of expenses by comparing the most recent year versus the preceding year 5 2. Provide a probable cause for each significant expense variance obtain in 1. above 5 3. Provide a realistic recommendation for improvement for the variances identified in 2. above. 2 I J K L M N 0 P 4. Prepare a budget variance report that compares actual spending by "Item Class" in 2016 for the General Government category, by using the budget worksheet included in the Excel data file. Use cell references for the actual spending totals. Use conditional formatting (use the "Shapes, 3 Signs" style) to denote the direction of the percentage variances. You will want to denote any variance that is more than +/-10% with a red diamond, between +/-3-9.99% with a yellow diamond, and less than +/- 3% Q R S T
Step by Step Solution
There are 3 Steps involved in it
Step: 1

See step-by-step solutions with expert insights and AI powered tools for academic success
Step: 2

Step: 3

Ace Your Homework with AI
Get the answers you need in no time with our AI-driven, step-by-step assistance
Get Started


