Answered step by step
Verified Expert Solution
Question
1 Approved Answer
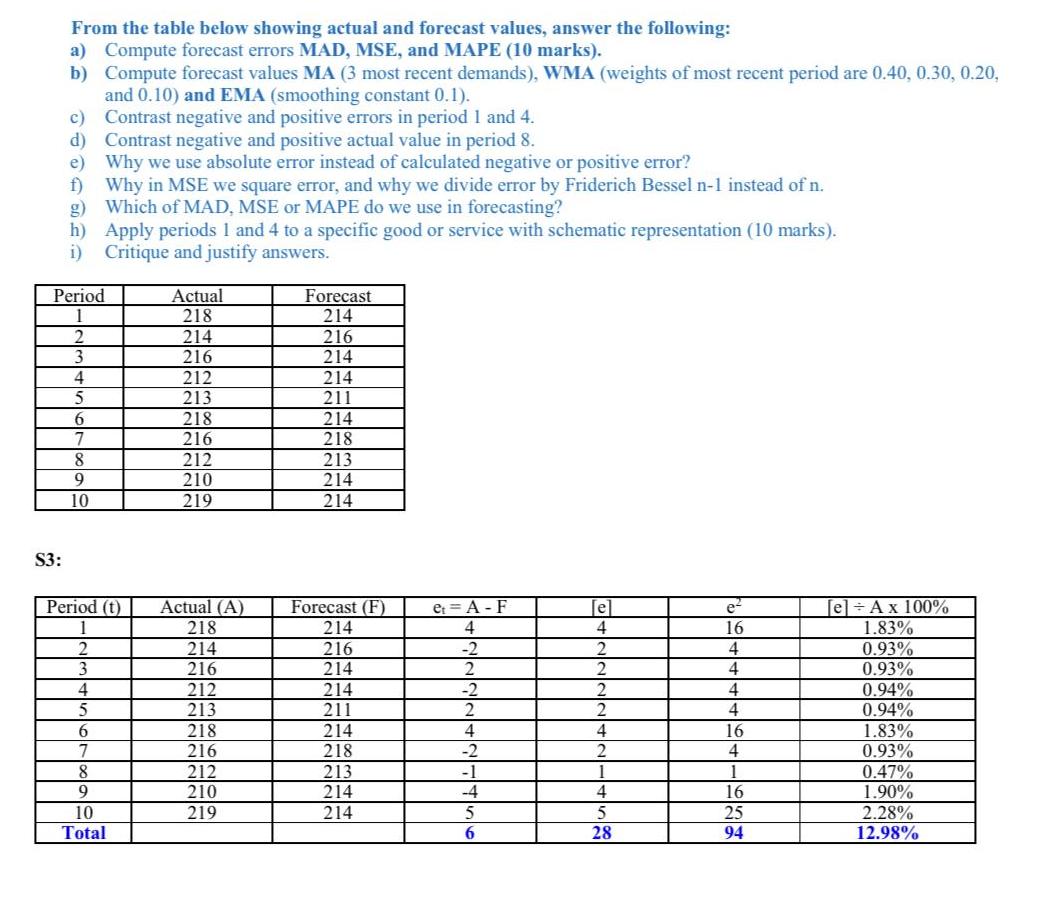
From the table below showing actual and forecast values, answer the following: a) Compute forecast errors MAD, MSE, and MAPE (10 marks). S3: b)

From the table below showing actual and forecast values, answer the following: a) Compute forecast errors MAD, MSE, and MAPE (10 marks). S3: b) Compute forecast values MA (3 most recent demands), WMA (weights of most recent period are 0.40, 0.30, 0.20, and 0.10) and EMA (smoothing constant 0.1). Contrast negative and positive errors in period 1 and 4. Contrast negative and positive actual value in period 8. Why we use absolute error instead of calculated negative or positive error? f) Why in MSE we square error, and why we divide error by Friderich Bessel n-1 instead of n. Which of MAD, MSE or MAPE do we use in forecasting? g) h) Apply periods I and 4 to a specific good or service with schematic representation (10 marks). 1) Critique and justify answers. c) d) e) Period 2 3 4 5 6 7 8 9 10 Period (t) 2 3 4 5 6 7 8 9 10 Total Actual 218 214 216 212 213 218 216 212 210 219 Actual (A) 218 214 216 212 213 218 216 212 210 219 Forecast 214 216 214 214 211 214 218 213 214 214 Forecast (F) 214 216 214 214 211 214 218 213 214 214 et = A - F 4 -2 2 -2 2 4 -2 -1. -4 5 6 e 4 2 2 2 2 4 2 1 4 5 28 e 16 4 4 4 4 16 4 1 16 25 94 [e] A x 100% 1.83% 0.93% 0.93% 0.94% 0.94% 1.83% 0.93% 0.47% 1.90% 2.28% 12.98%
Step by Step Solution
★★★★★
3.44 Rating (151 Votes )
There are 3 Steps involved in it
Step: 1
ANSWER a To compute the forecast errors MAD MSE and MAPE we need the following formulas Mean Absolute Deviation MAD MAD e1 e2 en n Mean Squared Error MSE MSE e12 e22 en2 n Mean Absolute Percentage Err...
Get Instant Access to Expert-Tailored Solutions
See step-by-step solutions with expert insights and AI powered tools for academic success
Step: 2

Step: 3

Ace Your Homework with AI
Get the answers you need in no time with our AI-driven, step-by-step assistance
Get Started


