

Answered step by step
Verified Expert Solution
Question
1 Approved Answer
L04 E19-5A. Break-Even Chart Set up a break-even chart similar to the one in Exhibit 19-12 with proportional scales from zero to $72,000 (in $12,000
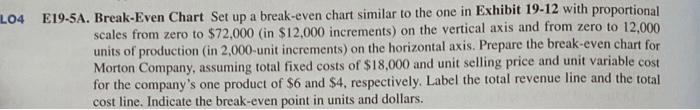
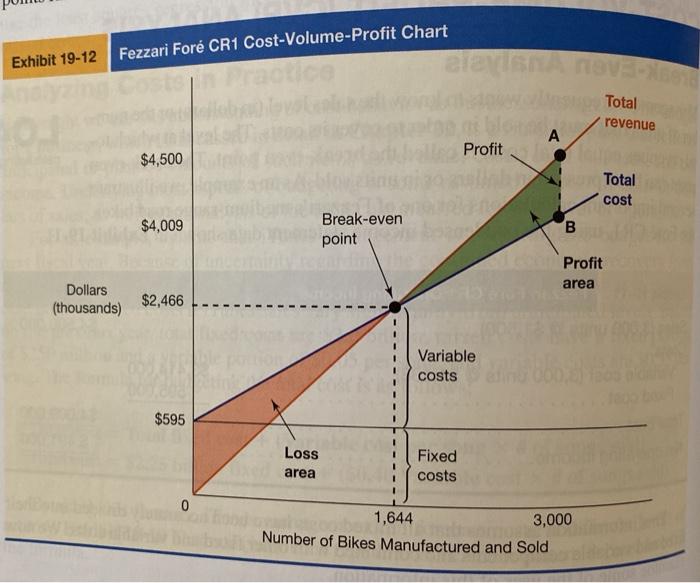 L04 E19-5A. Break-Even Chart Set up a break-even chart similar to the one in Exhibit 19-12 with proportional scales from zero to $72,000 (in $12,000 increments) on the vertical axis and from zero to 12,000 units of production (in 2,000-unit increments) on the horizontal axis. Prepare the break-even chart for Morton Company, assuming total fixed costs of $18,000 and unit selling price and unit variable cost for the company's one product of $6 and $4, respectively. Label the total revenue line and the total cost line. Indicate the break-even point in units and dollars. Fezzari For CR1 Cost-Volume-Profit Chart Exhibit 19-12 Total revenue A Profit $4,500 Total cost $4,009 Break-even point B Profit area Dollars (thousands) $2,466 Variable costs $595 Loss area Fixed costs 0 1,644 3,000 Number of Bikes Manufactured and Sold
Step by Step Solution
There are 3 Steps involved in it
Step: 1

Get Instant Access to Expert-Tailored Solutions
See step-by-step solutions with expert insights and AI powered tools for academic success
Step: 2

Step: 3
Ace Your Homework with AI
Get the answers you need in no time with our AI-driven, step-by-step assistance
Get Started
Financial Statement Analysis And Earnings Forecasting In Accounting
Authors: Steven J Monahan
1st Edition
1680834509, 978-1680834505