Question
la) Using charts #1, #2 and the Use for Savings Identity. (focus only on 2008 and beyondthe end of charts #1 & #2). If we


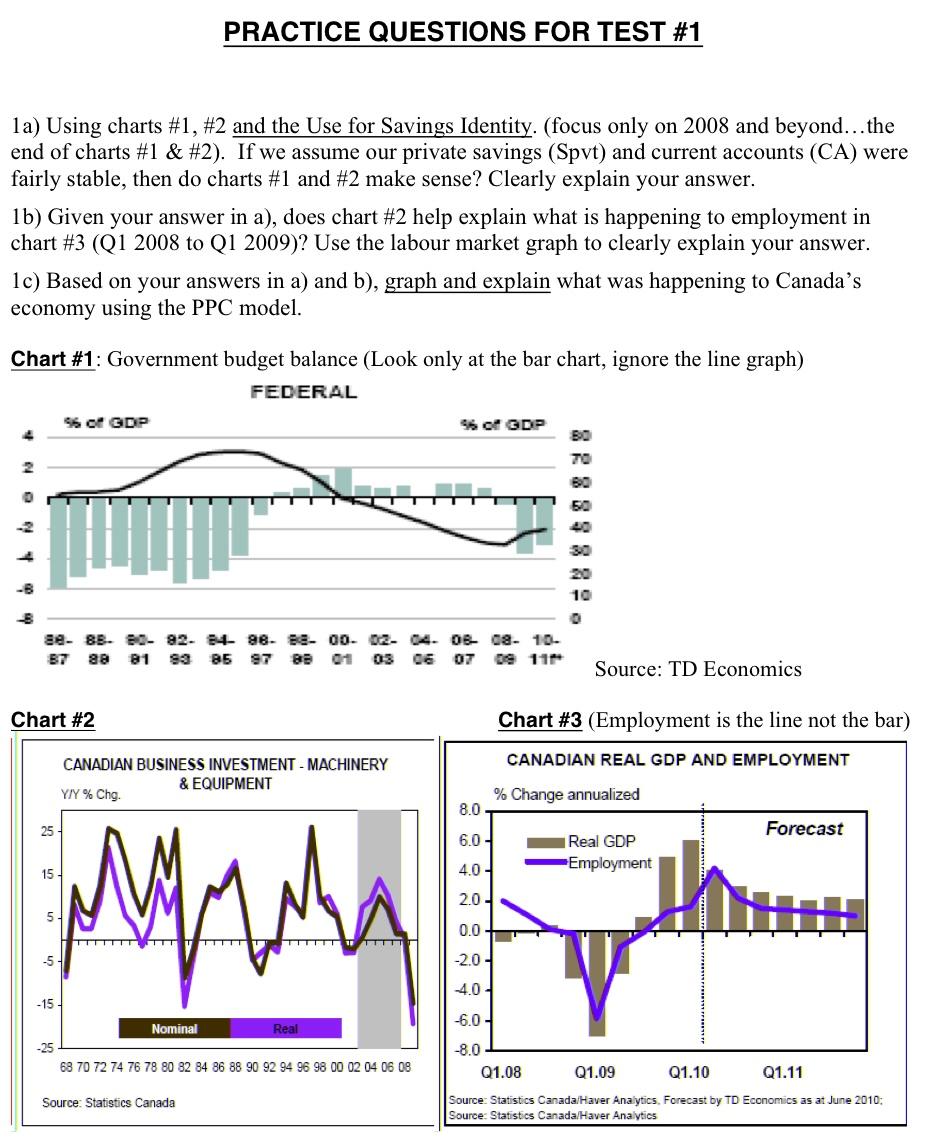
la) Using charts #1, #2 and the Use for Savings Identity. (focus only on 2008 and beyondthe end of charts #1 & #2). If we assume our private savings (Spvt) and current accounts (CA) were fairlv stable. then do charts #1 and #2 make sense? Clearly explain your answer. 1b) Given your answer in a), does chart #2 help explain what is happening to employment in chart #3 (Q1 2008 to Q1 2009)? Use the labour market graph to clearly explain your answer. 1c) Based on your answers in a) and b), graph and explain what was happening to Canada's economy using the PPC model. Chart #1; Government budget balance (Look only at the bar chart, ignore the line graph)
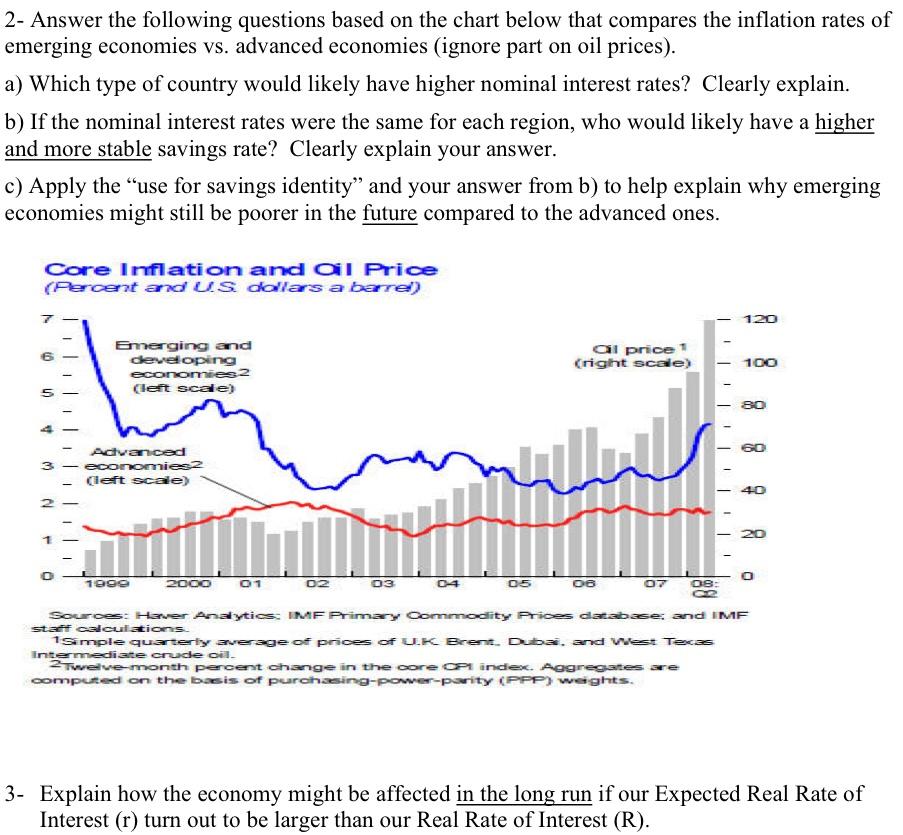
2- Answer the following questions based on the chart below that compares the inflation rates of emerging economies vs. advanced economies (ignore part on oil prices). a) Which type of country would likely have higher nominal interest rates? Clearly explain. b) If the nominal interest rates were the same for each region. who would likely have a higher and more stable savings rate? Clearly explain your answer. c) Apply the "use for savings identity" and your answer from b) to help explain why emerging economies might still be poorer in the future compared to the advanced ones.
3. Explain how the economy might be affected in the long run if our Expected Real Rate of Interest (r) turn out to be larger than our Real Rate of Interest (R).
PRACTICE QUESTIONS FOR TEST #1 1a) Using charts #1, #2 and the Use for Savings Identity. (focus only on 2008 and beyond...the end of charts #1 & #2). If we assume our private savings (Spvt) and current accounts (CA) were fairly stable, then do charts #1 and #2 make sense? Clearly explain your answer. 1b) Given your answer in a), does chart #2 help explain what is happening to employment in chart #3 (Q1 2008 to Q1 2009)? Use the labour market graph to clearly explain your answer. 1c) Based on your answers in a) and b), graph and explain what was happening to Canada's economy using the PPC model. Chart #1: Government budget balance (Look only at the bar chart, ignore the line graph) FEDERAL 960 GDP 96 o GDP 30 TO 80 50 40 30 20 10 se- 83. 80-82. 84-88 88- 00. 02. 04. OB 08. 10- 87 aa 81 93 85 97 88 01 03 06 OT 09 111 Source: TD Economics Chart #2 Chart #3 (Employment is the line not the bar) CANADIAN REAL GDP AND EMPLOYMENT CANADIAN BUSINESS INVESTMENT - MACHINERY & EQUIPMENT YY%Chg. % Change annualized 8.0 25 Forecast 6.0 Real GDP Employment 15 4.0 - 2.0 5 M 0.0 -2.0- 4.0 - -15 -6.0 - Nominal Real -25 68 70 72 74 76 78 80 82 84 86 88 90 92 94 96 98 00 02 04 06 08 -8.0 Q1.08 Q1.09 Q1.10 Q1.11 Source: Statistics Canada Source: Statistics Canada/Haver Analytics, Forecast by TD Economics as at June 2010: Source: Statistics Canada/Haver Analytics 2- Answer the following questions based on the chart below that compares the inflation rates of emerging economies vs. advanced economies (ignore part on oil prices). a) Which type of country would likely have higher nominal interest rates? Clearly explain. b) If the nominal interest rates were the same for each region, who would likely have a higher and more stable savings rate? Clearly explain your answer. c) Apply the use for savings identity" and your answer from b) to help explain why emerging economies might still be poorer in the future compared to the advanced ones. Core Inflation and al Price (Percent and US dollars a barrel) 7 120 6 Emerging and developing economies 2 (left scale) al price 1 (right scale) 100 80 5 4 Advanced 3 - economiesz Cleft scale) 2 40 20 1 O 1900 2000 01 02 03 04 05 06 07 OB: Source: Haver Analytics, IMF Primary Commodity Prices database: and IMF sta calculations 1Simple quarterly average of prices of UK Brent Duba. and West Texas Intermediate crude oil 2Twelve month percent change in the core a index. Aggregates are computed on the basis of purchasing-power-parity (PPP) weights. 3- Explain how the economy might be affected in the long run if our Expected Real Rate of Interest (r) turn out to be larger than our Real Rate of Interest (R). PRACTICE QUESTIONS FOR TEST #1 1a) Using charts #1, #2 and the Use for Savings Identity. (focus only on 2008 and beyond...the end of charts #1 & #2). If we assume our private savings (Spvt) and current accounts (CA) were fairly stable, then do charts #1 and #2 make sense? Clearly explain your answer. 1b) Given your answer in a), does chart #2 help explain what is happening to employment in chart #3 (Q1 2008 to Q1 2009)? Use the labour market graph to clearly explain your answer. 1c) Based on your answers in a) and b), graph and explain what was happening to Canada's economy using the PPC model. Chart #1: Government budget balance (Look only at the bar chart, ignore the line graph) FEDERAL 960 GDP 96 o GDP 30 TO 80 50 40 30 20 10 se- 83. 80-82. 84-88 88- 00. 02. 04. OB 08. 10- 87 aa 81 93 85 97 88 01 03 06 OT 09 111 Source: TD Economics Chart #2 Chart #3 (Employment is the line not the bar) CANADIAN REAL GDP AND EMPLOYMENT CANADIAN BUSINESS INVESTMENT - MACHINERY & EQUIPMENT YY%Chg. % Change annualized 8.0 25 Forecast 6.0 Real GDP Employment 15 4.0 - 2.0 5 M 0.0 -2.0- 4.0 - -15 -6.0 - Nominal Real -25 68 70 72 74 76 78 80 82 84 86 88 90 92 94 96 98 00 02 04 06 08 -8.0 Q1.08 Q1.09 Q1.10 Q1.11 Source: Statistics Canada Source: Statistics Canada/Haver Analytics, Forecast by TD Economics as at June 2010: Source: Statistics Canada/Haver Analytics 2- Answer the following questions based on the chart below that compares the inflation rates of emerging economies vs. advanced economies (ignore part on oil prices). a) Which type of country would likely have higher nominal interest rates? Clearly explain. b) If the nominal interest rates were the same for each region, who would likely have a higher and more stable savings rate? Clearly explain your answer. c) Apply the use for savings identity" and your answer from b) to help explain why emerging economies might still be poorer in the future compared to the advanced ones. Core Inflation and al Price (Percent and US dollars a barrel) 7 120 6 Emerging and developing economies 2 (left scale) al price 1 (right scale) 100 80 5 4 Advanced 3 - economiesz Cleft scale) 2 40 20 1 O 1900 2000 01 02 03 04 05 06 07 OB: Source: Haver Analytics, IMF Primary Commodity Prices database: and IMF sta calculations 1Simple quarterly average of prices of UK Brent Duba. and West Texas Intermediate crude oil 2Twelve month percent change in the core a index. Aggregates are computed on the basis of purchasing-power-parity (PPP) weights. 3- Explain how the economy might be affected in the long run if our Expected Real Rate of Interest (r) turn out to be larger than our Real Rate of Interest (R)Step by Step Solution
There are 3 Steps involved in it
Step: 1

Get Instant Access to Expert-Tailored Solutions
See step-by-step solutions with expert insights and AI powered tools for academic success
Step: 2

Step: 3

Ace Your Homework with AI
Get the answers you need in no time with our AI-driven, step-by-step assistance
Get Started


