Answered step by step
Verified Expert Solution
Question
1 Approved Answer
Lab 1 Report Guidelines Data collected from your lab section will be combined a master data sheet that will be emailed to you by
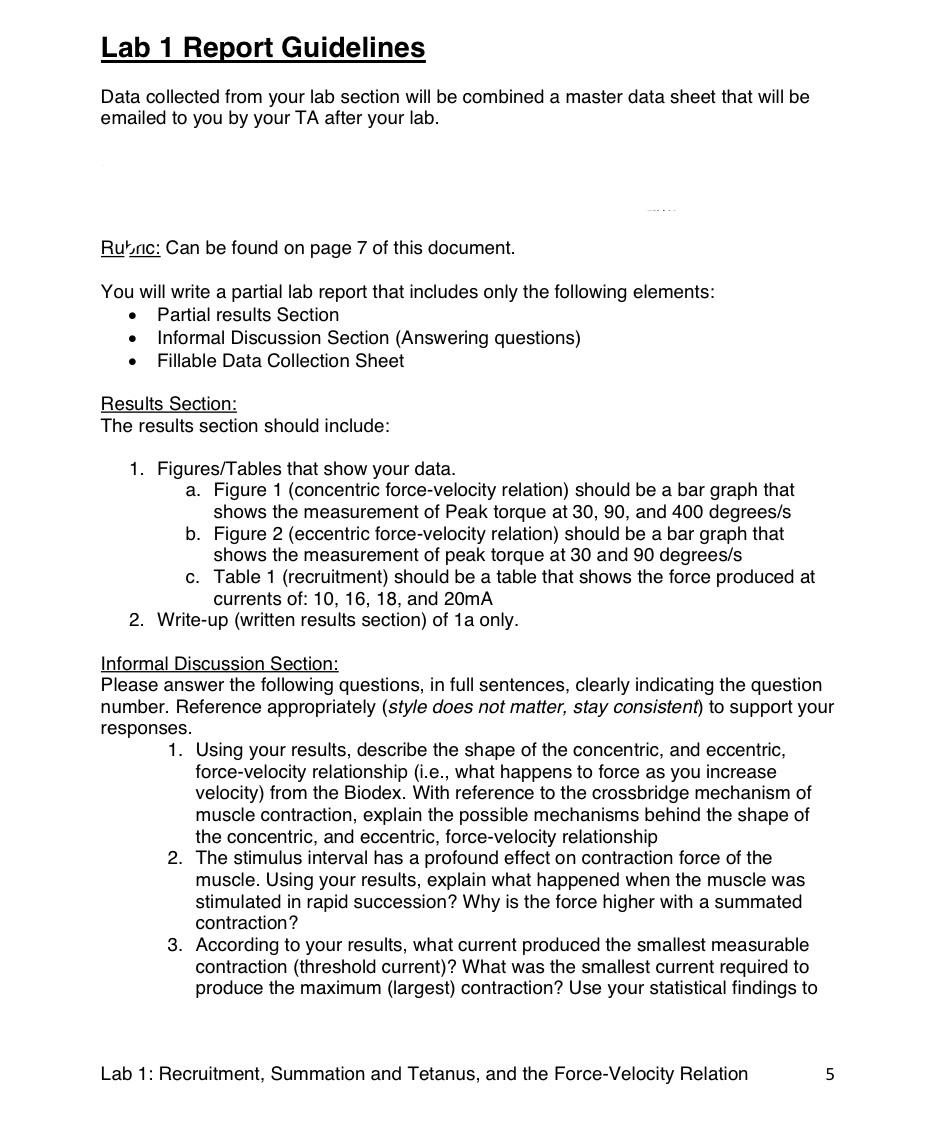
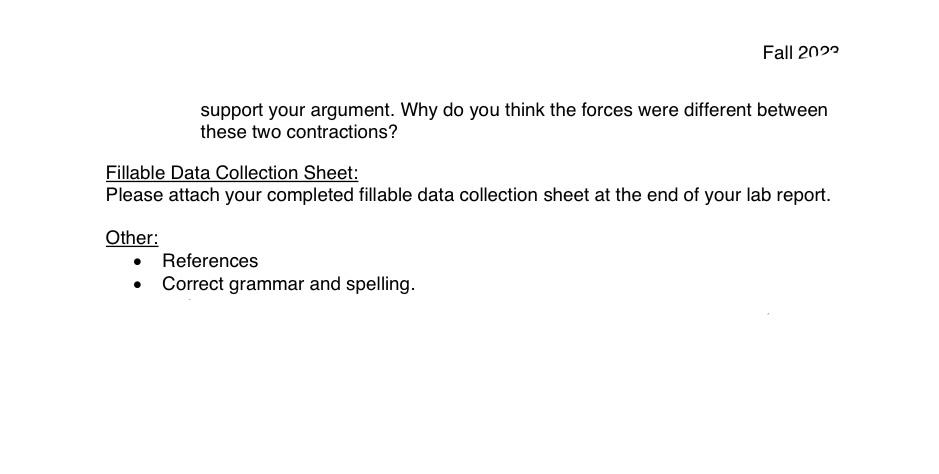
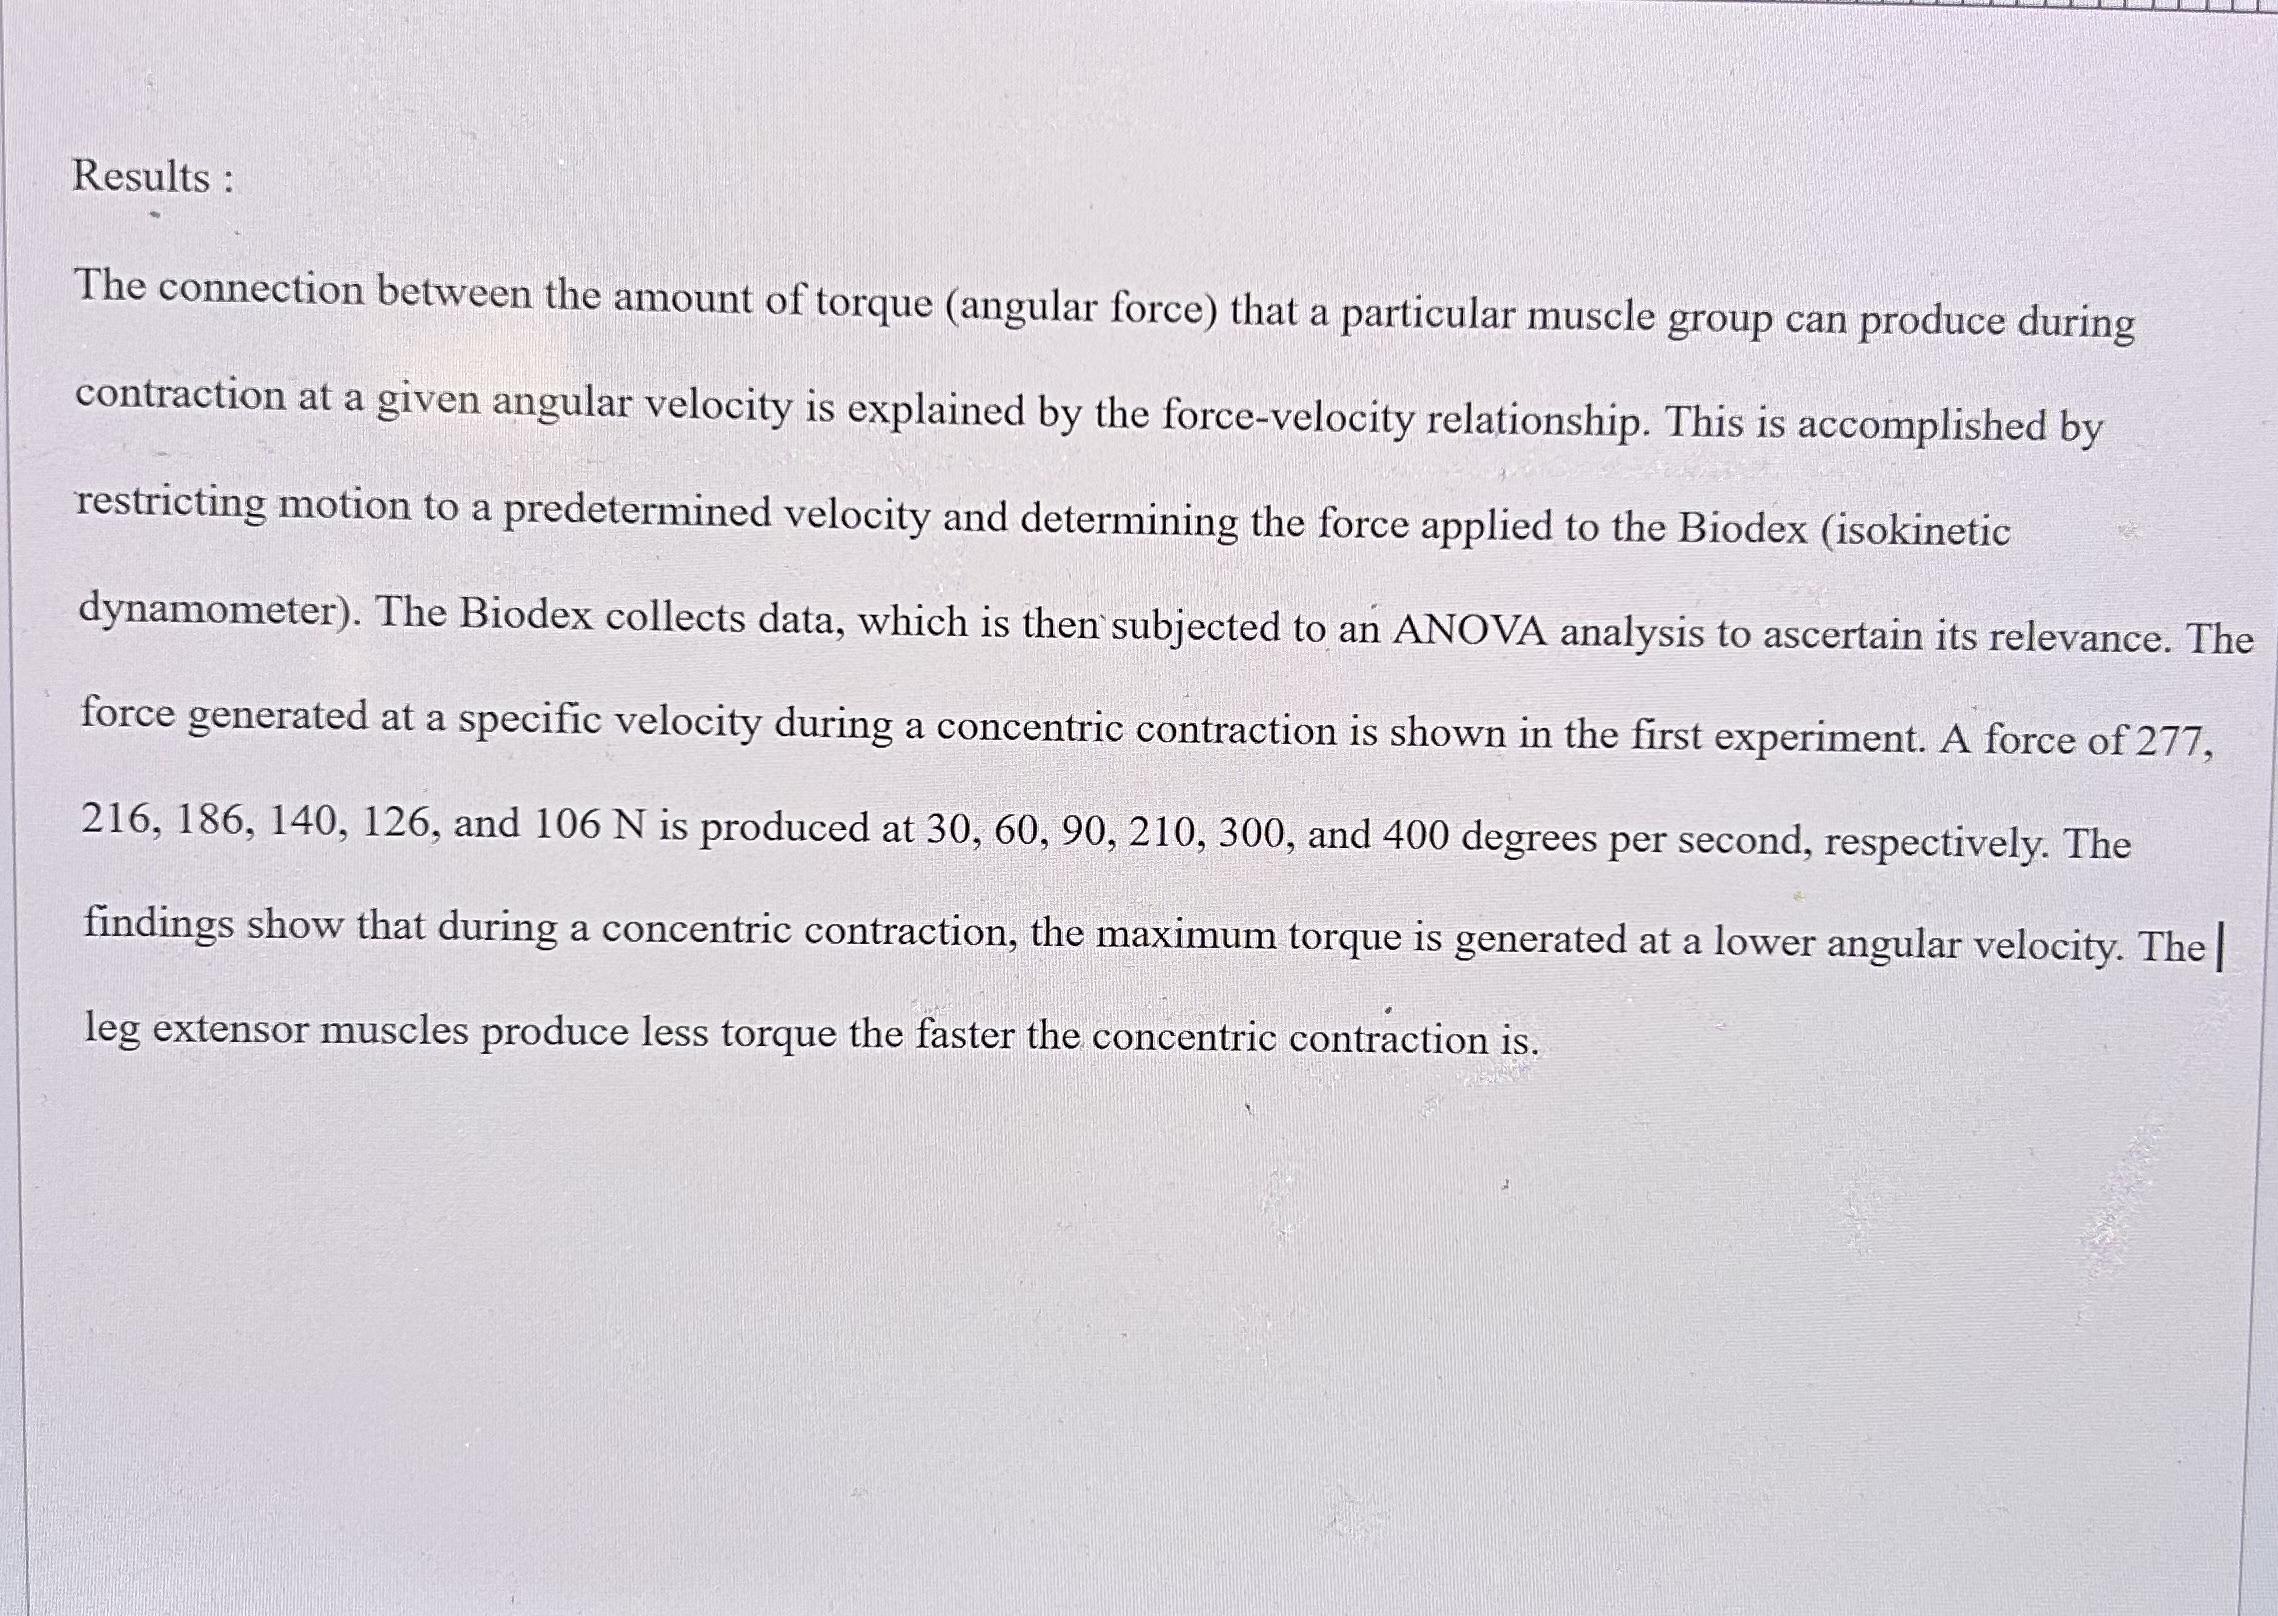
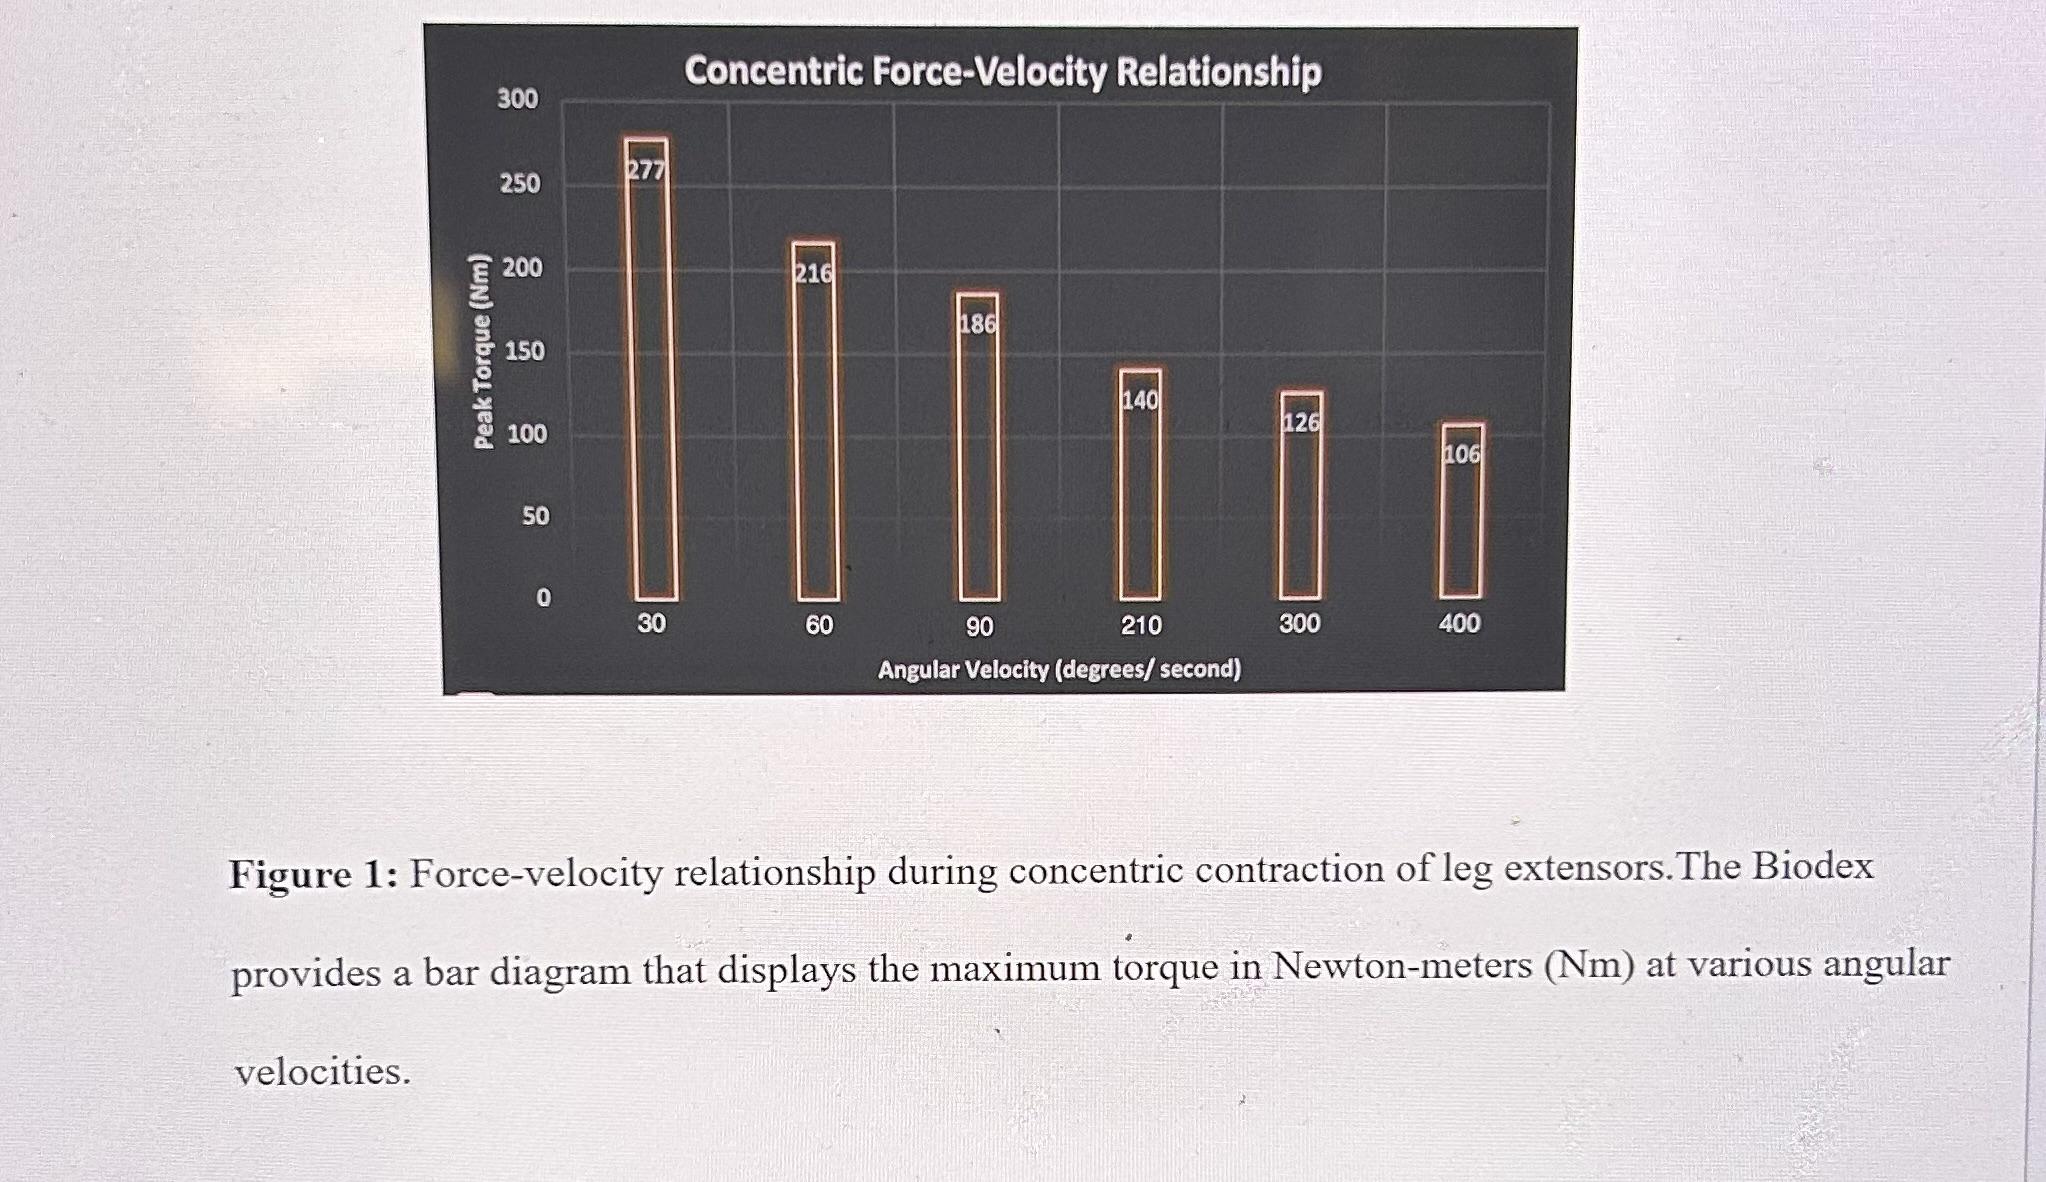
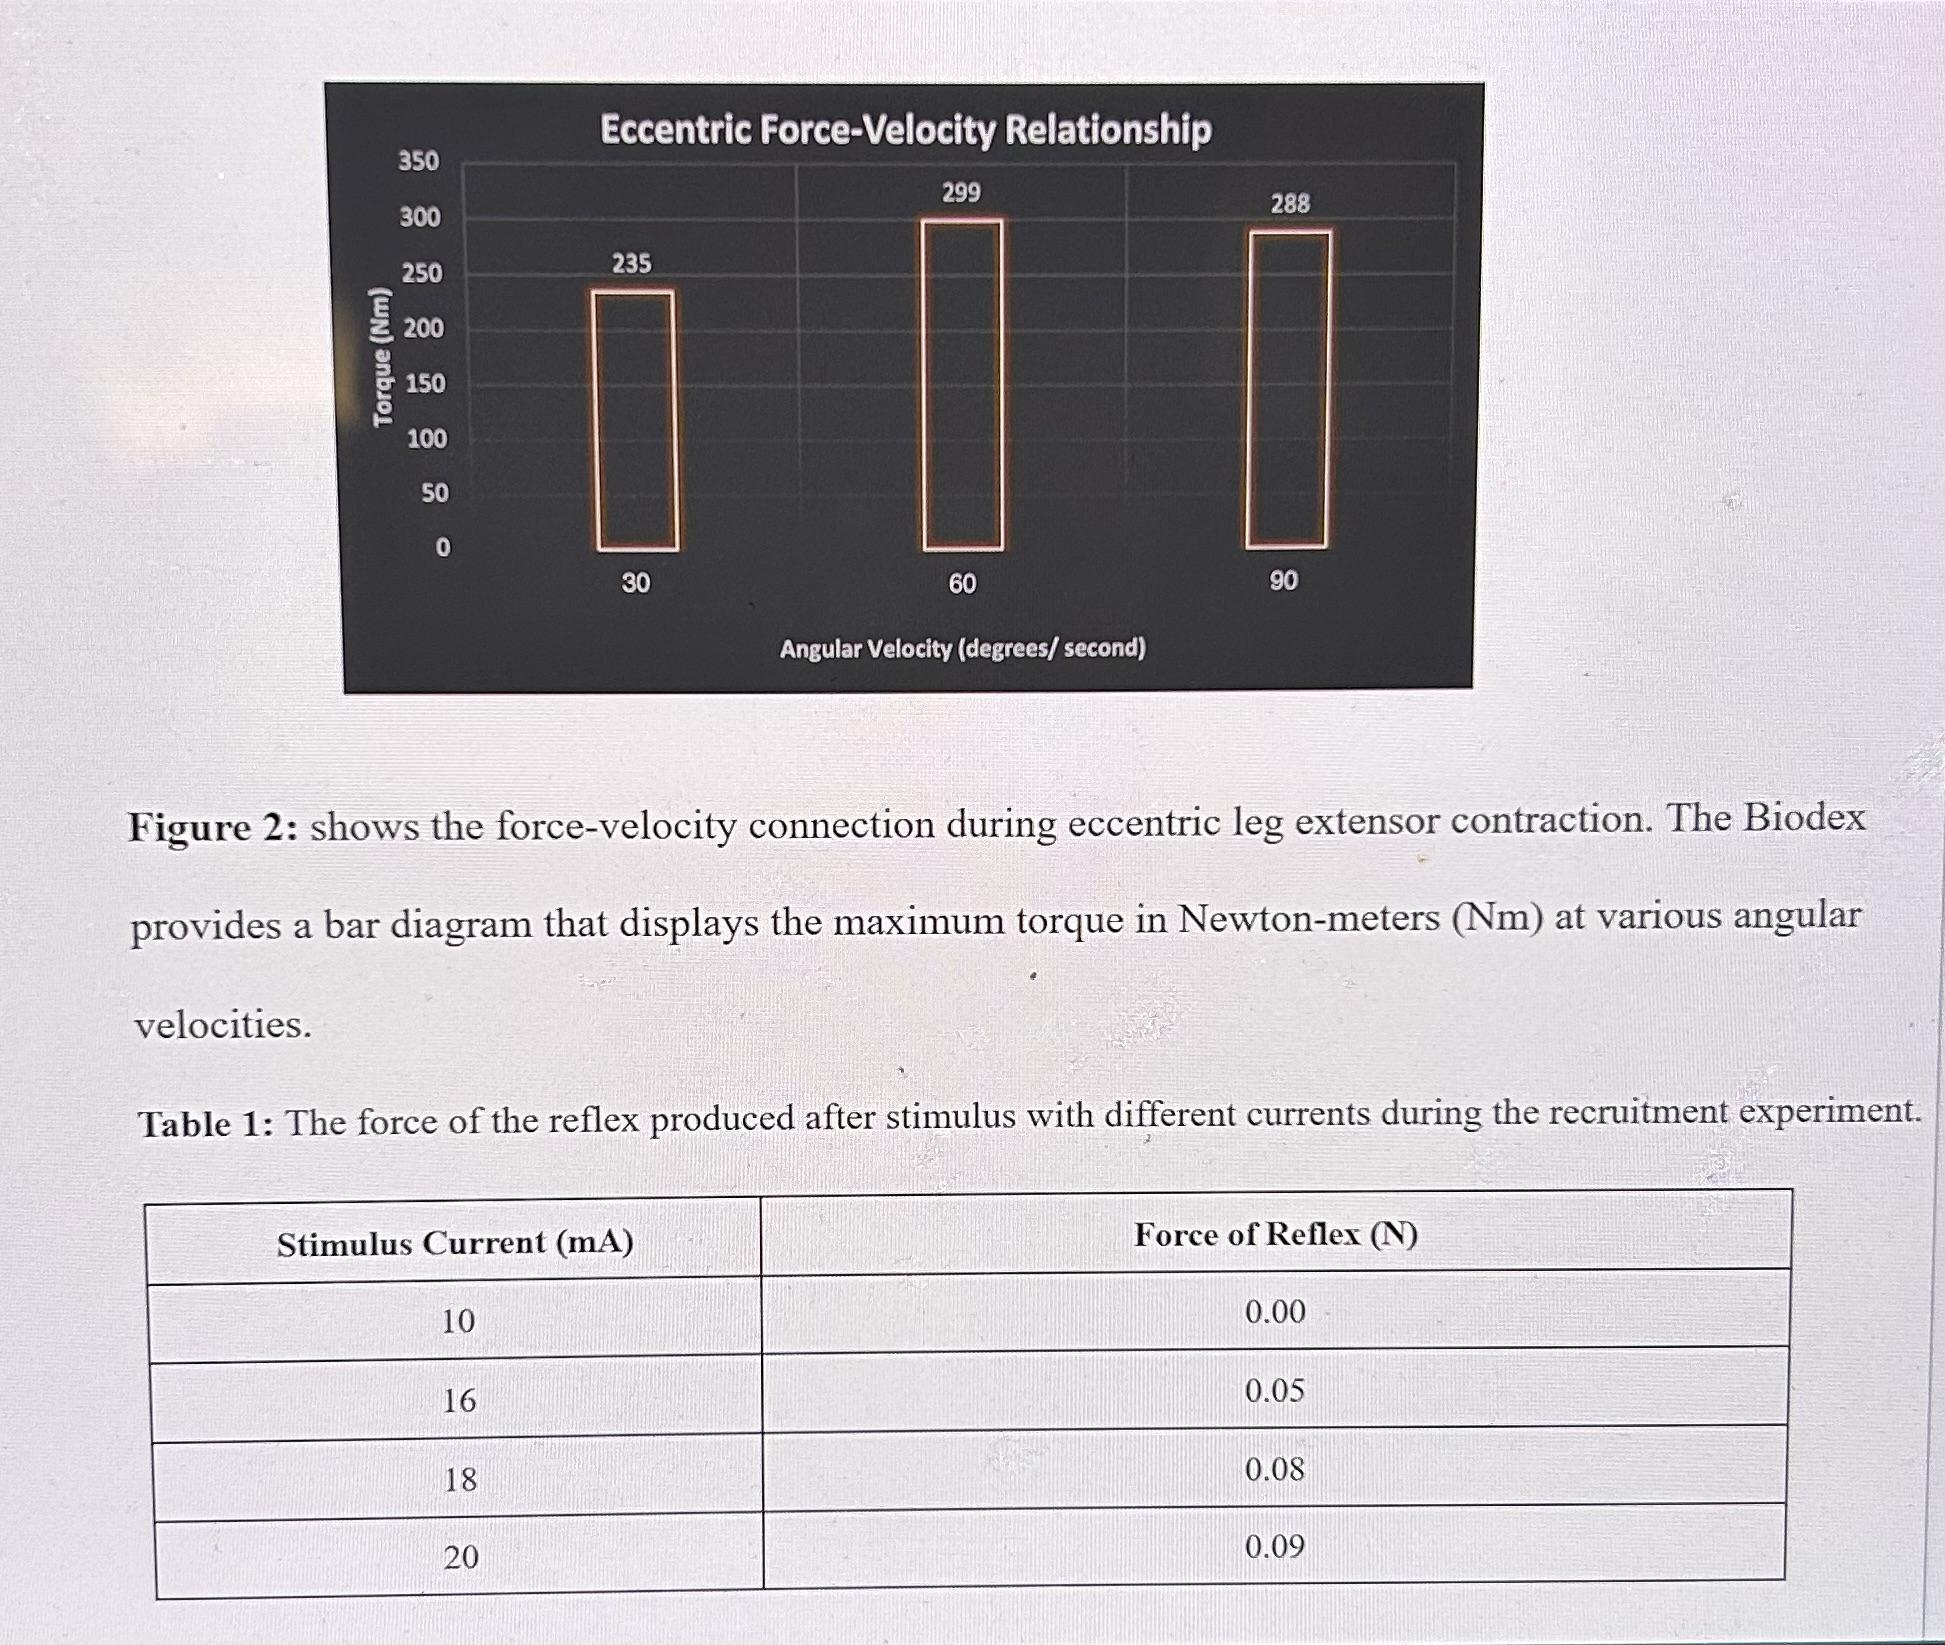
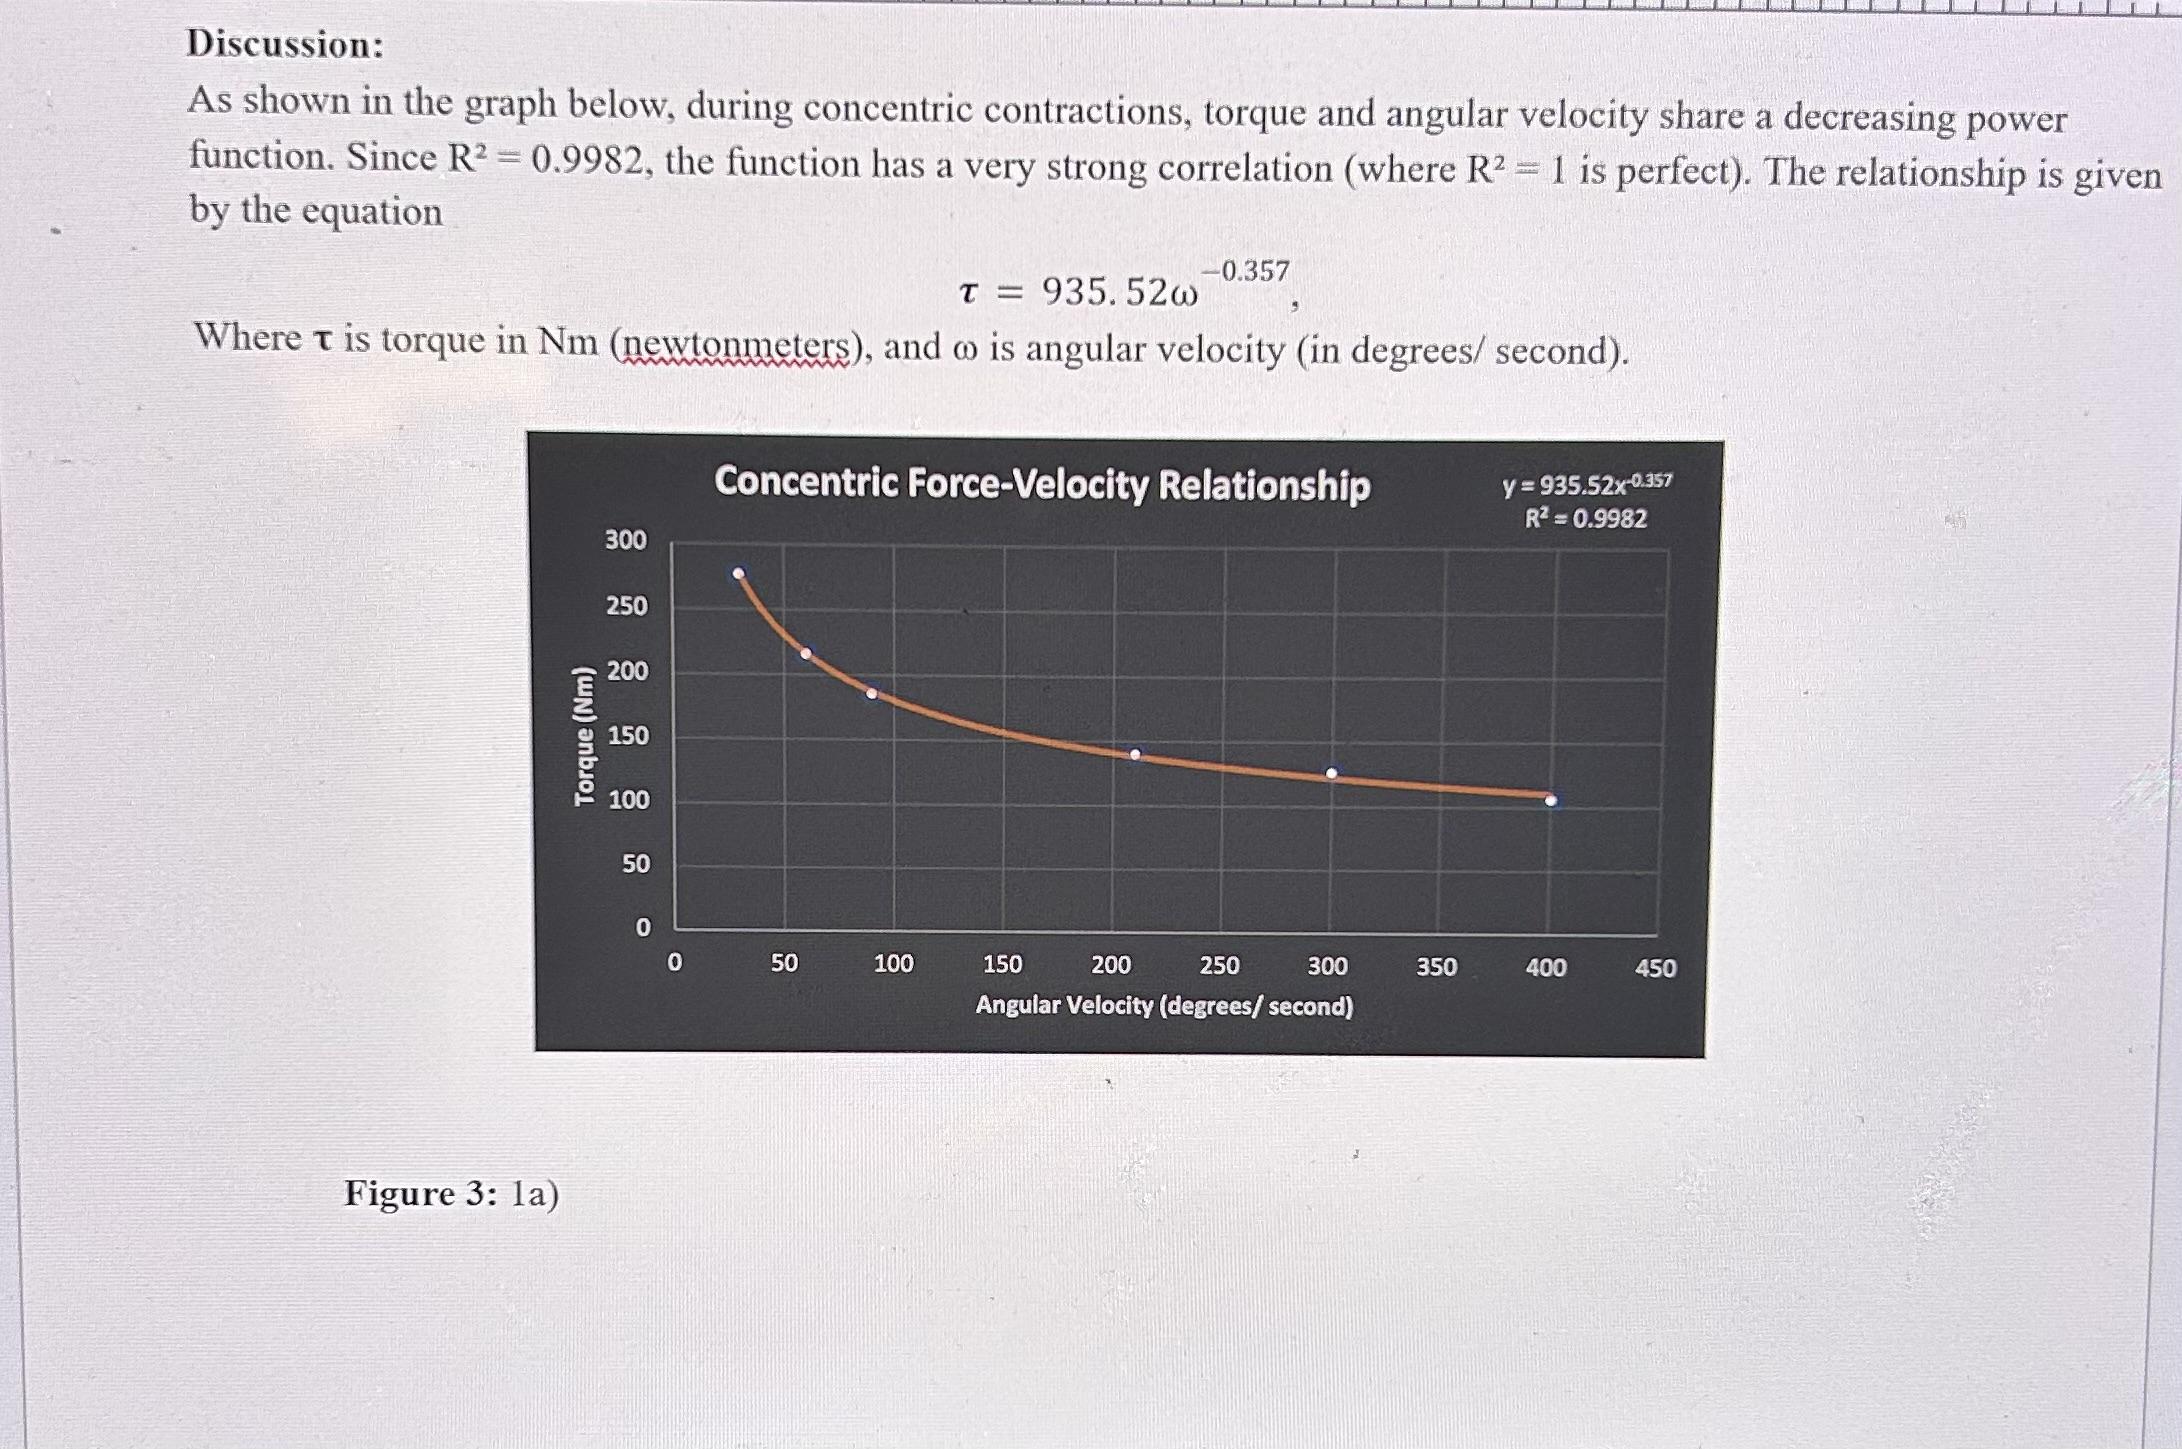
Lab 1 Report Guidelines Data collected from your lab section will be combined a master data sheet that will be emailed to you by your TA after your lab. Rubric: Can be found on page 7 of this document. You will write a partial lab report that includes only the following elements: Partial results Section Informal Discussion Section (Answering questions) Fillable Data Collection Sheet Results Section: The results section should include: 1. Figures/Tables that show your data. a. Figure 1 (concentric force-velocity relation) should be a bar graph that shows the measurement of Peak torque at 30, 90, and 400 degrees/s b. Figure 2 (eccentric force-velocity relation) should be a bar graph that shows the measurement of peak torque at 30 and 90 degrees/s c. Table 1 (recruitment) should be a table that shows the force produced at currents of: 10, 16, 18, and 20mA 2. Write-up (written results section) of 1a only. Informal Discussion Section: Please answer the following questions, in full sentences, clearly indicating the question number. Reference appropriately (style does not matter, stay consistent) to support your responses. 1. Using your results, describe the shape of the concentric, and eccentric, force-velocity relationship (i.e., what happens to force as you increase velocity) from the Biodex. With reference to the crossbridge mechanism of muscle contraction, explain the possible mechanisms behind the shape of the concentric, and eccentric, force-velocity relationship 2. The stimulus interval has a profound effect on contraction force of the muscle. Using your results, explain what happened when the muscle was stimulated in rapid succession? Why is the force higher with a summated contraction? 3. According to your results, what current produced the smallest measurable contraction (threshold current)? What was the smallest current required to produce the maximum (largest) contraction? Use your statistical findings to Lab 1: Recruitment, Summation and Tetanus, and the Force-Velocity Relation 5 Fall 2022 support your argument. Why do you think the forces were different between these two contractions? Fillable Data Collection Sheet: Please attach your completed fillable data collection sheet at the end of your lab report. Other: References Correct grammar and spelling. Results: The connection between the amount of torque (angular force) that a particular muscle group can produce during contraction at a given angular velocity is explained by the force-velocity relationship. This is accomplished by restricting motion to a predetermined velocity and determining the force applied to the Biodex (isokinetic dynamometer). The Biodex collects data, which is then subjected to an ANOVA analysis to ascertain its relevance. The force generated at a specific velocity during a concentric contraction is shown in the first experiment. A force of 277, 216, 186, 140, 126, and 106 N is produced at 30, 60, 90, 210, 300, and 400 degrees per second, respectively. The findings show that during a concentric contraction, the maximum torque is generated at a lower angular velocity. The | leg extensor muscles produce less torque the faster the concentric contraction is. Peak Torque (Nm) 300 277 250 200 150 100 50 0 30 30 Concentric Force-Velocity Relationship 216 186 60 90 40 140 126 106 210 300 400 Angular Velocity (degrees/second) Figure 1: Force-velocity relationship during concentric contraction of leg extensors. The Biodex provides a bar diagram that displays the maximum torque in Newton-meters (Nm) at various angular velocities. Torque (Nm) Eccentric Force-Velocity Relationship 350 300 235 250 200 150 100 50 0 299 288 000 30 90 Angular Velocity (degrees/second) Figure 2: shows the force-velocity connection during eccentric leg extensor contraction. The Biodex provides a bar diagram that displays the maximum torque in Newton-meters (Nm) at various angular velocities. Table 1: The force of the reflex produced after stimulus with different currents during the recruitment experiment. Stimulus Current (mA) 10 Force of Reflex (N) 0.00 16 0.05 18 0.08 0.09 20 Discussion: As shown in the graph below, during concentric contractions, torque and angular velocity share a decreasing power function. Since R2 = 0.9982, the function has a very strong correlation (where R2 = 1 is perfect). The relationship is given by the equation -0.357 T = 935.52w Where is torque in Nm (newtonmeters), and co is angular velocity (in degrees/ second). Figure 3: 1a) Torque (Nm) Concentric Force-Velocity Relationship y=935.52x-0.357 R = 0.9982 300 250 200 150 100 50 0 0 50 100 150 200 Angular Velocity (degrees/second) 250 300 350 400 450
Step by Step Solution
There are 3 Steps involved in it
Step: 1

Get Instant Access to Expert-Tailored Solutions
See step-by-step solutions with expert insights and AI powered tools for academic success
Step: 2

Step: 3

Ace Your Homework with AI
Get the answers you need in no time with our AI-driven, step-by-step assistance
Get Started


