Lab 8-2, Use XBRLAnalyst to Create Dynamic Common-Size Financial Statements
See question below. Please help create this, thanks
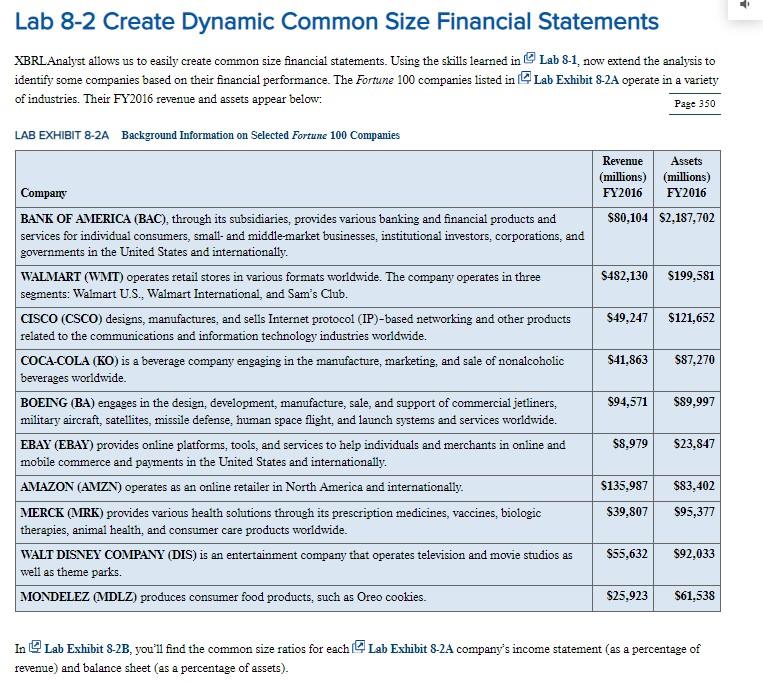
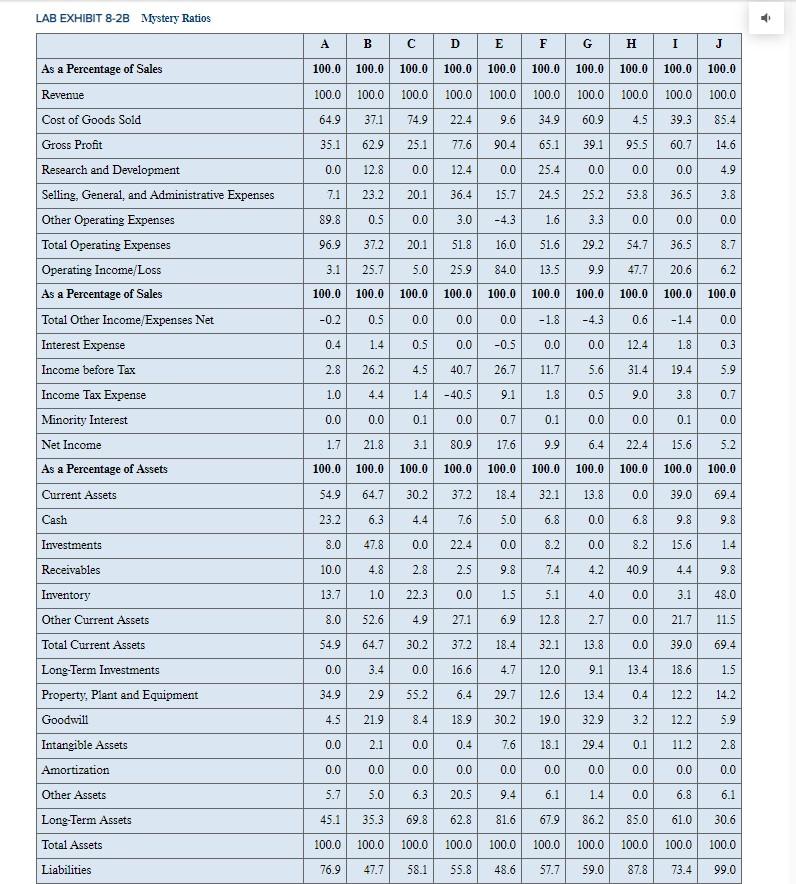
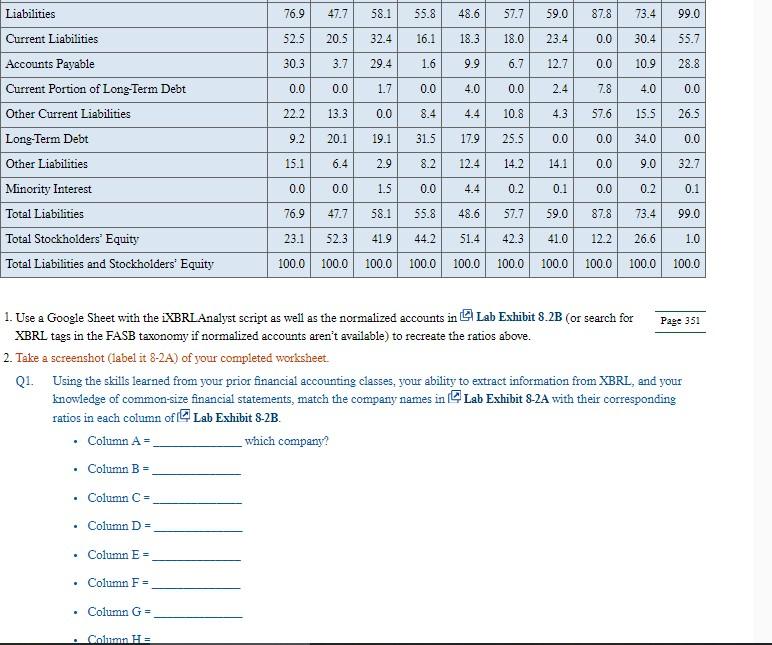
i Assets Lab 8-2 Create Dynamic Common Size Financial Statements XBRL Analyst allows us to easily create common size financial statements. Using the skills learned in Lab 8-1, now extend the analysis to identify some companies based on their financial performance. The Fortune 100 companies listed in Lab Exhibit 8-2A operate in a variety of industries. Their FY2016 revenue and assets appear below: Page 350 LAB EXHIBIT 8-2A Background Information on Selected Fortune 100 Companies Revenue (millions) (millions) Company FY2016 FY2016 BANK OF AMERICA (BAC), through its subsidiaries, provides various banking and financial products and $80,104 $2.187,702 services for individual consumers, small and middle-market businesses, institutional investors, corporations, and governments in the United States and internationally. WALMART (WMT) operates retail stores in various formats worldwide. The company operates in three $482,130 $199,581 segments: Walmart U.S., Walmart International, and Sam's Club. CISCO (CSCO) designs, manufactures, and sells Internet protocol (IP)-based networking and other products $49,247 $121,652 related to the communications and information technology industries worldwide. COCA-COLA (KO) is a beverage company engaging in the manufacture, marketing, and sale of nonalcoholic $41.863 $87,270 beverages worldwide. BOEING (BA) engages in the design, development, manufacture, sale, and support of commercial jetliners, $94,571 $89,997 military aircraft, satellites, missile defense, human space flight, and launch systems and services worldwide. EBAY (EBAY) provides online platforms, tools, and services to help individuals and merchants in online and $8.979 $23.847 mobile commerce and payments in the United States and internationally AMAZON (AMZN) operates as an online retailer in North America and internationally $135,987 $83,402 MERCK (MRK) provides various health solutions through its prescription medicines, vaccines, biologic $39.807 S95,377 therapies, animal health, and consumer care products worldwide. WALT DISNEY COMPANY (DIS) is an entertainment company that operates television and movie studios as $55,632 $92,033 well as theme parks. MONDELEZ (MDLZ) produces consumer food products, such as Oreo cookies. $25,923 $61,538 In Lab Exhibit S-2B, you'll find the common size ratios for each Lab Exhibit 8-2A company's income statement (as a percentage of revenue) and balance sheet (as a percentage of assets). LAB EXHIBIT 8-2B Mystery Ratios A B C D E F G H I J 100.0 100.0 100.0 100.0 100.0 100.0 100.0 100.0 100.0 100.0 100.0 100.0 100.0 100.0 100.0 100.0 100.0 100.0 100.0 100.0 64.9 37.1 74.9 22.4 9.6 34.9 60.9 4.5 39.3 85.4 35.1 62.9 25.1 77.6 90.4 65.1 39.1 95.5 60.7 14.6 0.0 12.8 0.0 12.4 0.0 25.4 0.0 0.0 0.0 4.9 7.1 23.2 20.1 36.4 15.7 24.5 25.2 53.8 36.5 3.8 89.8 0.5 0.0 3.0 -4.3 1.6 3.3 0.0 0.0 0.0 96.9 37.2 20.1 51.8 16.0 51.6 29.2 54.7 36.5 8.7 3.1 25.7 5.0 25.9 84.0 13.5 9.9 47.7 20.6 6.2 100.0 100.0 100.0 100.0 100.0 100.0 100.0 100.0 100.0 100.0 -0.2 0.5 0.0 0.0 0.0 -1.8 -4.3 0.6 -1.4 0.0 As a Percentage of Sales Revenue Cost of Goods Sold Gross Profit Research and Development Selling, General, and Administrative Expenses Other Operating Expenses Total Operating Expenses Operating Income/Loss As a Percentage of Sales Total Other Income Expenses Net Interest Expense Income before Tax Income Tax Expense Minority Interest Net Income As a Percentage of Assets Current Assets Cash Investments Receivables Inventory 0.4 1.4 0.5 0.0 -0.5 0.0 0.0 12.4 1.8 0.3 2.8 26.2 4.5 40.7 26.7 11.7 5.6 31.4 19.4 5.9 1.0 4.4 1.4 -40.5 9.1 1.8 0.5 9.0 3.8 0.7 0.0 0.0 0.1 0.0 0.7 0.1 0.0 0.0 0.1 0.0 1.7 21.8 3.1 80.9 17.6 9.9 6.4 22.4 15.6 5.2 100.0 100.0 100.0 100.0 100.0 100.0 100.0 100.0 100.0 100.0 54.9 64.7 30.2 37.2 18.4 32.1 13.8 0.0 39.0 69.4 23.2 6.3 4.4 7.6 5.0 6.8 0.0 6.8 9.8 9.8 8.0 47.8 0.0 22.4 0.0 8.2 0.0 8.2 15.6 1.4 10.0 4.8 2.8 2.5 9.8 7.4 4.2 40.9 4.4 9.8 13.7 1.0 22.3 0.0 1.5 5.1 4.0 0.0 3.1 48.0 - Other Current Assets 8.0 52.6 4.9 6.9 12.8 2.7 0.0 21.7 11.5 Total Current Assets 54.9 64.7 30.2 37.2 18.4 32.1 13.8 0.0 39.0 69.4 0.0 3.4 0.0 16.6 4.7 12.0 9.1 13.4 18.6 1.5 34.9 2.9 55.2 6.4 29.7 12.6 13.4 0.4 12.2 14.2 4.5 21.9 8.4 18.9 30.2 19.0 32.9 3.2 12.2 5.9 Long-Term Investments Property, Plant and Equipment Goodwill Intangible Assets Amortization Other Assets Long-Term Assets 0.0 2.1 0.0 0.4 7.6 18.1 29.4 0.1 11.2 2.8 0.0 0.0 0.0 0.0 0.0 0.0 0.0 0.0 0.0 0.0 5.7 5.0 6.3 20.5 9.4 6.1 1.4 0.0 6.8 6.1 45.1 35.3 69.8 62.8 81.6 67.9 86.2 85.0 61.0 30.6 Total Assets 100.0 100.0 100.0 100.0 100.0 100.0 100.0 100.0 100.0 100.0 Liabilities 76.9 47.7 58.1 55.8 48.6 57.7 59.0 87.8 73.4 99.0 76.9 47.7 58.1 55.8 48.6 57.7 59.0 87.8 73.4 99.0 52.5 20.5 32.4 16.1 18.3 18.0 23.4 0.0 30.4 55.7 30.3 3.7 29.4 1.6 9.9 6.7 12.7 0.0 10.9 28.8 0.0 0.0 1.7 0.0 4.0 0.0 2.4 7.8 4.0 0.0 22.2 13.3 0.0 8.4 4.4 10.8 4.3 57.6 15.5 26.5 Liabilities Current Liabilities Accounts Payable Current Portion of Long Term Debt Other Current Liabilities Long-Term Debt Other Liabilities Minority Interest Total Liabilities Total Stockholders' Equity Total Liabilities and Stockholders' Equity 9.2 20.1 19.1 31.5 17.9 25.5 0.0 0.0 34.0 0.0 15.1 6.4 2.9 8.2 12.4 14.2 14.1 0.0 9.0 32.7 0.0 0.0 1.5 0.0 4.4 0.2 0.1 0.0 0.1 0.1 76.9 47.7 58.1 55.8 48.6 57.7 59.0 87.8 73.4 99.0 41.9 44.2 51.4 42.3 41.0 12.2 26.6 1.0 23.1 52.3 100.0 100.0 100.0 100.0 100.0 100.0 100.0 100.0 100.0 100.0 1. Use a Google Sheet with the XBRL Analyst script as well as the normalized accounts in Lab Exhibit 8.2B (or search for Page 351 XBRL tags in the FASB taxonomy if normalized accounts aren't available) to recreate the ratios above. 2. Take a screenshot (label it 8-2A) of your completed worksheet. Q1. Using the skills learned from your prior financial accounting classes, your ability to extract information from XBRL, and your knowledge of common-size financial statements, match the company names in Lab Exhibit 8-2A with their corresponding ratios in each column of Lab Exhibit 8-2B. Column A - which company? Column B - Column C = Column D = Column E = Column F = Column G = Column H = 1. Use a Google Sheet with the XBRL Analyst script as well as the normalized accounts in Lab Exhibit 8.2B (or search for Page 351 XBRL tags in the FASB taxonomy if normalized accounts aren't available) to recreate the ratios above. 2. Take a screenshot (label it 8-2A) of your completed worksheet. Q1. Using the skills learned from your prior financial accounting classes, your ability to extract information from XBRL, and your knowledge of common-size financial statements, match the company names in Lab Exhibit 8-2A with their corresponding ratios in each column of Lab Exhibit 8-2B. Column A= which company? Column B - . Column C = Column D = Column E = Column F= Column G+ Column H- Column I = Column J = End of Lab Page 352 i Assets Lab 8-2 Create Dynamic Common Size Financial Statements XBRL Analyst allows us to easily create common size financial statements. Using the skills learned in Lab 8-1, now extend the analysis to identify some companies based on their financial performance. The Fortune 100 companies listed in Lab Exhibit 8-2A operate in a variety of industries. Their FY2016 revenue and assets appear below: Page 350 LAB EXHIBIT 8-2A Background Information on Selected Fortune 100 Companies Revenue (millions) (millions) Company FY2016 FY2016 BANK OF AMERICA (BAC), through its subsidiaries, provides various banking and financial products and $80,104 $2.187,702 services for individual consumers, small and middle-market businesses, institutional investors, corporations, and governments in the United States and internationally. WALMART (WMT) operates retail stores in various formats worldwide. The company operates in three $482,130 $199,581 segments: Walmart U.S., Walmart International, and Sam's Club. CISCO (CSCO) designs, manufactures, and sells Internet protocol (IP)-based networking and other products $49,247 $121,652 related to the communications and information technology industries worldwide. COCA-COLA (KO) is a beverage company engaging in the manufacture, marketing, and sale of nonalcoholic $41.863 $87,270 beverages worldwide. BOEING (BA) engages in the design, development, manufacture, sale, and support of commercial jetliners, $94,571 $89,997 military aircraft, satellites, missile defense, human space flight, and launch systems and services worldwide. EBAY (EBAY) provides online platforms, tools, and services to help individuals and merchants in online and $8.979 $23.847 mobile commerce and payments in the United States and internationally AMAZON (AMZN) operates as an online retailer in North America and internationally $135,987 $83,402 MERCK (MRK) provides various health solutions through its prescription medicines, vaccines, biologic $39.807 S95,377 therapies, animal health, and consumer care products worldwide. WALT DISNEY COMPANY (DIS) is an entertainment company that operates television and movie studios as $55,632 $92,033 well as theme parks. MONDELEZ (MDLZ) produces consumer food products, such as Oreo cookies. $25,923 $61,538 In Lab Exhibit S-2B, you'll find the common size ratios for each Lab Exhibit 8-2A company's income statement (as a percentage of revenue) and balance sheet (as a percentage of assets). LAB EXHIBIT 8-2B Mystery Ratios A B C D E F G H I J 100.0 100.0 100.0 100.0 100.0 100.0 100.0 100.0 100.0 100.0 100.0 100.0 100.0 100.0 100.0 100.0 100.0 100.0 100.0 100.0 64.9 37.1 74.9 22.4 9.6 34.9 60.9 4.5 39.3 85.4 35.1 62.9 25.1 77.6 90.4 65.1 39.1 95.5 60.7 14.6 0.0 12.8 0.0 12.4 0.0 25.4 0.0 0.0 0.0 4.9 7.1 23.2 20.1 36.4 15.7 24.5 25.2 53.8 36.5 3.8 89.8 0.5 0.0 3.0 -4.3 1.6 3.3 0.0 0.0 0.0 96.9 37.2 20.1 51.8 16.0 51.6 29.2 54.7 36.5 8.7 3.1 25.7 5.0 25.9 84.0 13.5 9.9 47.7 20.6 6.2 100.0 100.0 100.0 100.0 100.0 100.0 100.0 100.0 100.0 100.0 -0.2 0.5 0.0 0.0 0.0 -1.8 -4.3 0.6 -1.4 0.0 As a Percentage of Sales Revenue Cost of Goods Sold Gross Profit Research and Development Selling, General, and Administrative Expenses Other Operating Expenses Total Operating Expenses Operating Income/Loss As a Percentage of Sales Total Other Income Expenses Net Interest Expense Income before Tax Income Tax Expense Minority Interest Net Income As a Percentage of Assets Current Assets Cash Investments Receivables Inventory 0.4 1.4 0.5 0.0 -0.5 0.0 0.0 12.4 1.8 0.3 2.8 26.2 4.5 40.7 26.7 11.7 5.6 31.4 19.4 5.9 1.0 4.4 1.4 -40.5 9.1 1.8 0.5 9.0 3.8 0.7 0.0 0.0 0.1 0.0 0.7 0.1 0.0 0.0 0.1 0.0 1.7 21.8 3.1 80.9 17.6 9.9 6.4 22.4 15.6 5.2 100.0 100.0 100.0 100.0 100.0 100.0 100.0 100.0 100.0 100.0 54.9 64.7 30.2 37.2 18.4 32.1 13.8 0.0 39.0 69.4 23.2 6.3 4.4 7.6 5.0 6.8 0.0 6.8 9.8 9.8 8.0 47.8 0.0 22.4 0.0 8.2 0.0 8.2 15.6 1.4 10.0 4.8 2.8 2.5 9.8 7.4 4.2 40.9 4.4 9.8 13.7 1.0 22.3 0.0 1.5 5.1 4.0 0.0 3.1 48.0 - Other Current Assets 8.0 52.6 4.9 6.9 12.8 2.7 0.0 21.7 11.5 Total Current Assets 54.9 64.7 30.2 37.2 18.4 32.1 13.8 0.0 39.0 69.4 0.0 3.4 0.0 16.6 4.7 12.0 9.1 13.4 18.6 1.5 34.9 2.9 55.2 6.4 29.7 12.6 13.4 0.4 12.2 14.2 4.5 21.9 8.4 18.9 30.2 19.0 32.9 3.2 12.2 5.9 Long-Term Investments Property, Plant and Equipment Goodwill Intangible Assets Amortization Other Assets Long-Term Assets 0.0 2.1 0.0 0.4 7.6 18.1 29.4 0.1 11.2 2.8 0.0 0.0 0.0 0.0 0.0 0.0 0.0 0.0 0.0 0.0 5.7 5.0 6.3 20.5 9.4 6.1 1.4 0.0 6.8 6.1 45.1 35.3 69.8 62.8 81.6 67.9 86.2 85.0 61.0 30.6 Total Assets 100.0 100.0 100.0 100.0 100.0 100.0 100.0 100.0 100.0 100.0 Liabilities 76.9 47.7 58.1 55.8 48.6 57.7 59.0 87.8 73.4 99.0 76.9 47.7 58.1 55.8 48.6 57.7 59.0 87.8 73.4 99.0 52.5 20.5 32.4 16.1 18.3 18.0 23.4 0.0 30.4 55.7 30.3 3.7 29.4 1.6 9.9 6.7 12.7 0.0 10.9 28.8 0.0 0.0 1.7 0.0 4.0 0.0 2.4 7.8 4.0 0.0 22.2 13.3 0.0 8.4 4.4 10.8 4.3 57.6 15.5 26.5 Liabilities Current Liabilities Accounts Payable Current Portion of Long Term Debt Other Current Liabilities Long-Term Debt Other Liabilities Minority Interest Total Liabilities Total Stockholders' Equity Total Liabilities and Stockholders' Equity 9.2 20.1 19.1 31.5 17.9 25.5 0.0 0.0 34.0 0.0 15.1 6.4 2.9 8.2 12.4 14.2 14.1 0.0 9.0 32.7 0.0 0.0 1.5 0.0 4.4 0.2 0.1 0.0 0.1 0.1 76.9 47.7 58.1 55.8 48.6 57.7 59.0 87.8 73.4 99.0 41.9 44.2 51.4 42.3 41.0 12.2 26.6 1.0 23.1 52.3 100.0 100.0 100.0 100.0 100.0 100.0 100.0 100.0 100.0 100.0 1. Use a Google Sheet with the XBRL Analyst script as well as the normalized accounts in Lab Exhibit 8.2B (or search for Page 351 XBRL tags in the FASB taxonomy if normalized accounts aren't available) to recreate the ratios above. 2. Take a screenshot (label it 8-2A) of your completed worksheet. Q1. Using the skills learned from your prior financial accounting classes, your ability to extract information from XBRL, and your knowledge of common-size financial statements, match the company names in Lab Exhibit 8-2A with their corresponding ratios in each column of Lab Exhibit 8-2B. Column A - which company? Column B - Column C = Column D = Column E = Column F = Column G = Column H = 1. Use a Google Sheet with the XBRL Analyst script as well as the normalized accounts in Lab Exhibit 8.2B (or search for Page 351 XBRL tags in the FASB taxonomy if normalized accounts aren't available) to recreate the ratios above. 2. Take a screenshot (label it 8-2A) of your completed worksheet. Q1. Using the skills learned from your prior financial accounting classes, your ability to extract information from XBRL, and your knowledge of common-size financial statements, match the company names in Lab Exhibit 8-2A with their corresponding ratios in each column of Lab Exhibit 8-2B. Column A= which company? Column B - . Column C = Column D = Column E = Column F= Column G+ Column H- Column I = Column J = End of Lab Page 352