Answered step by step
Verified Expert Solution
Link Copied!

Question

1 Approved Answer

Lab midterm exam 3 For this exam, you need the data file called SPSS lab midterm exam 3.sav This is a made-up dataset on a
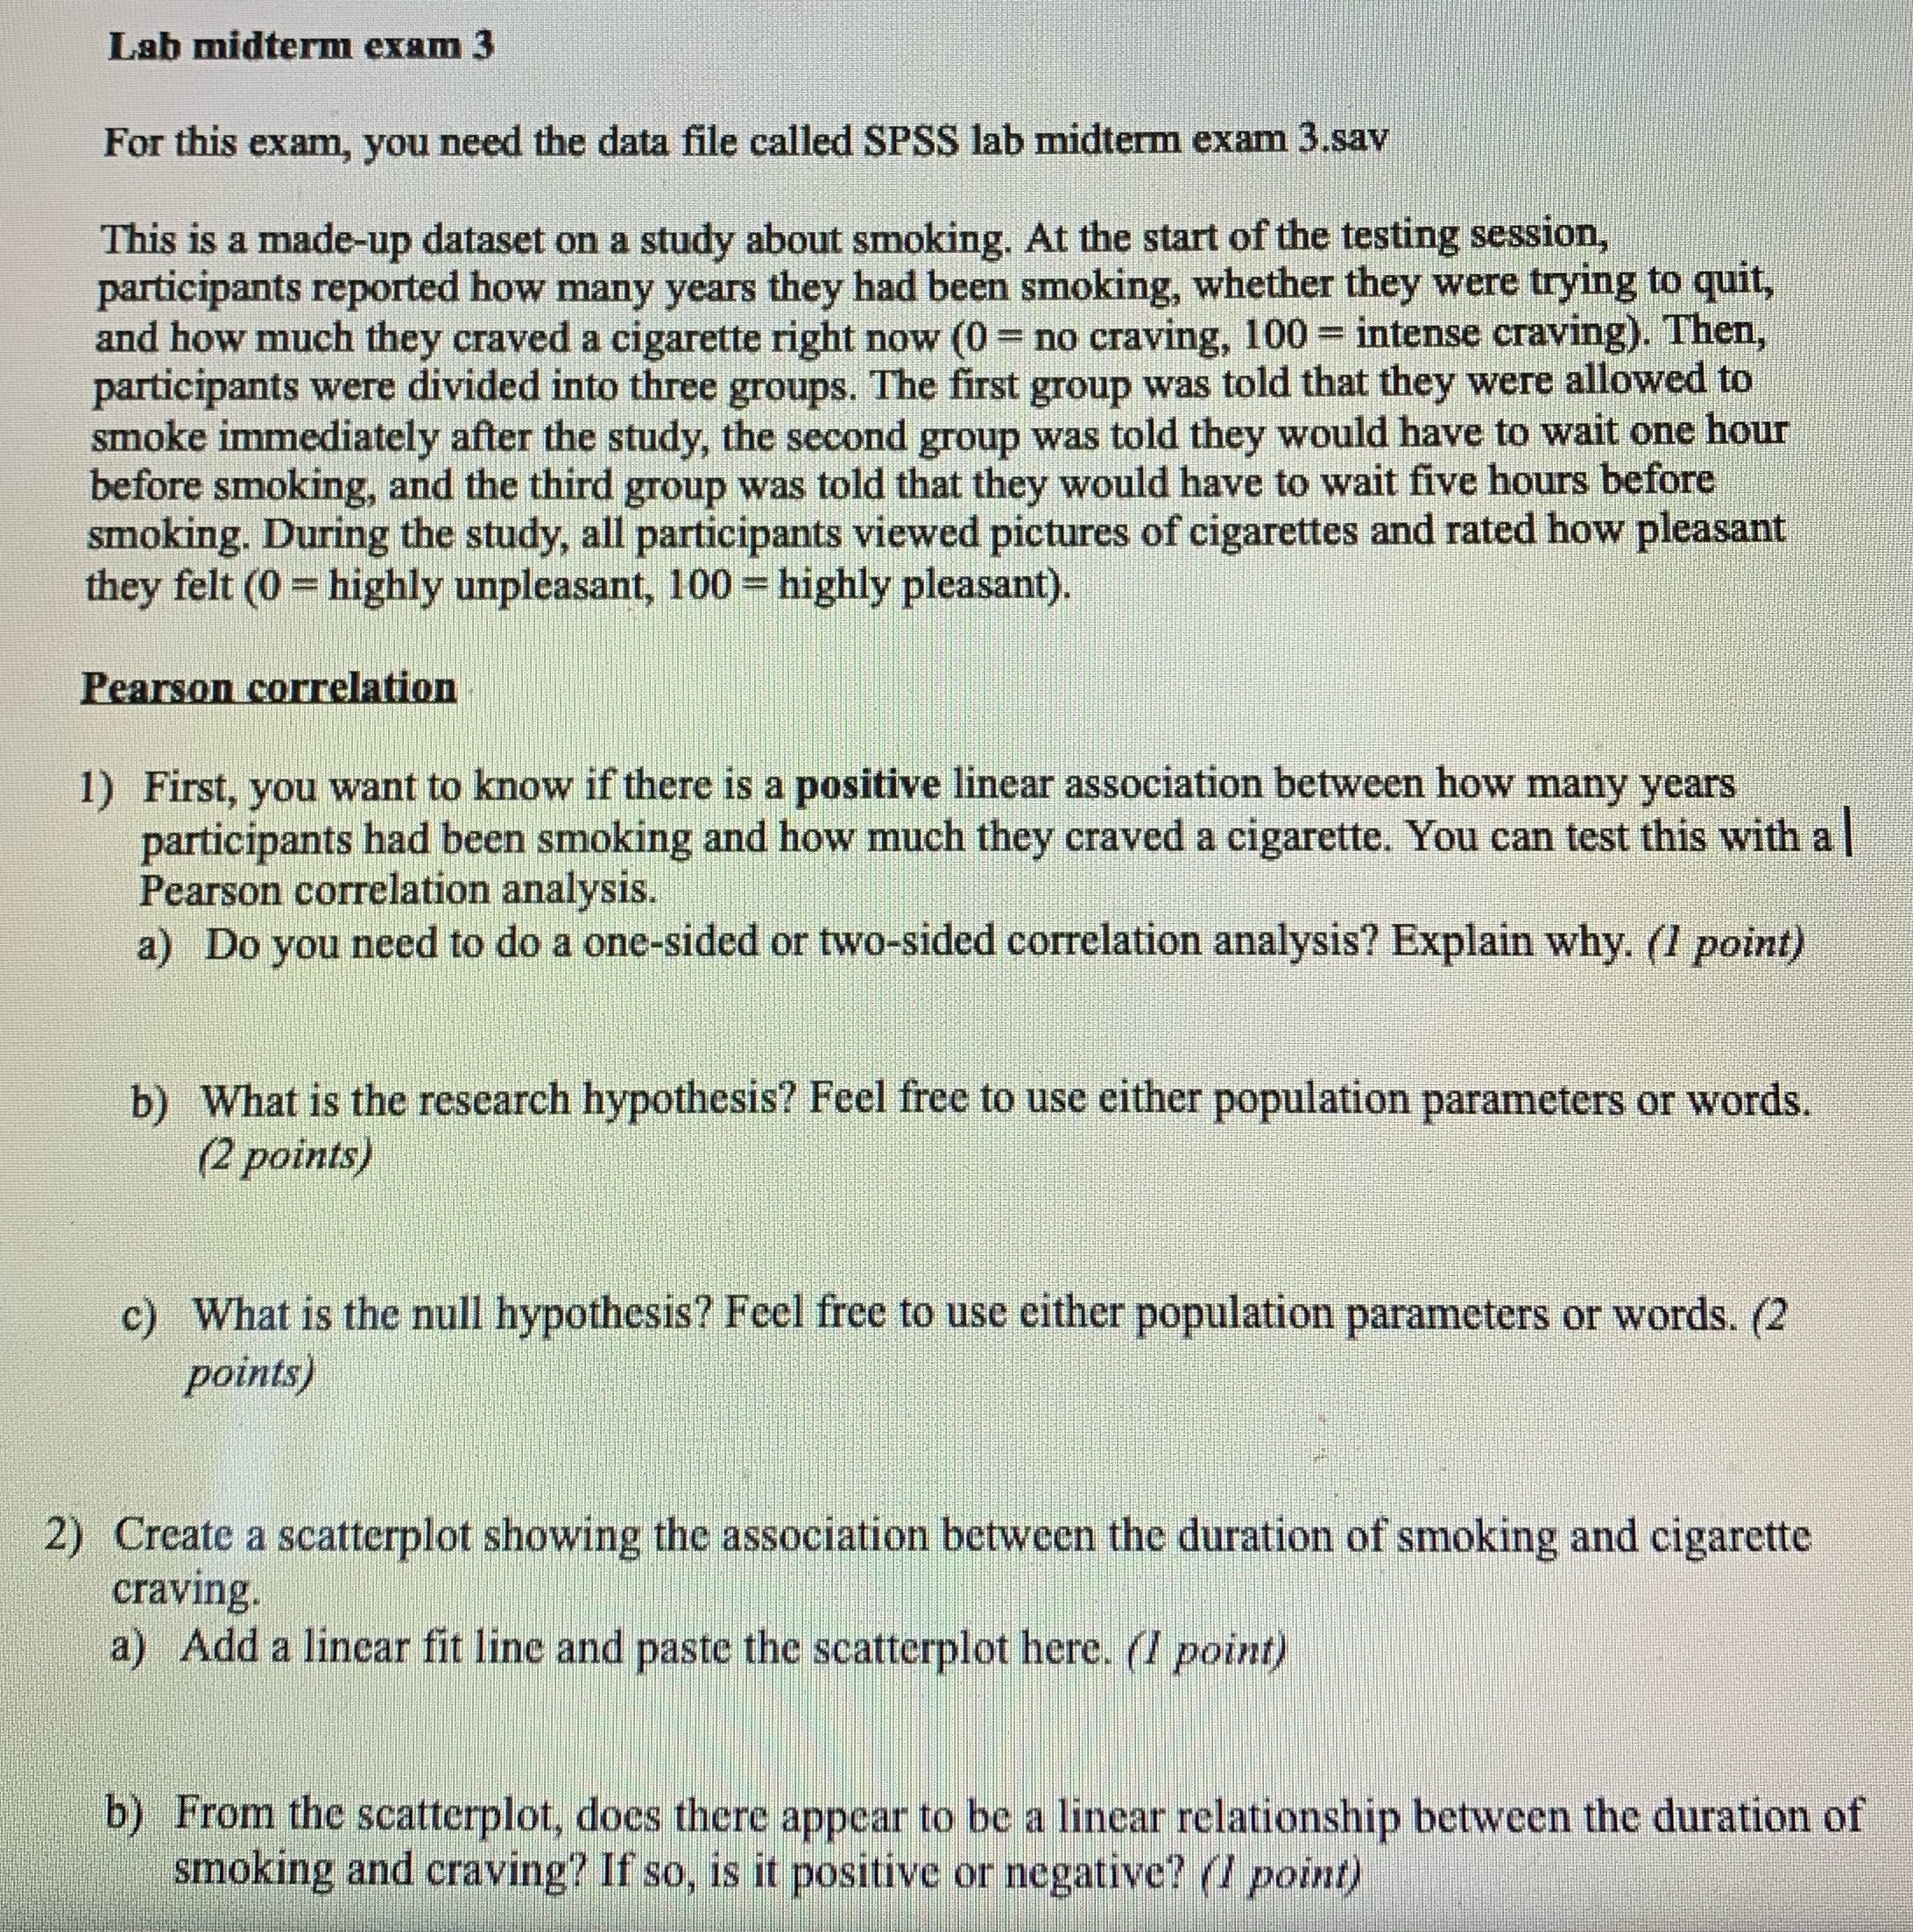
image text in transcribed
Lab midterm exam 3 For this exam, you need the data file called SPSS lab midterm exam 3.sav This is a made-up dataset on a study about smoking. At the start of the testing session, participants reported how many years they had been smoking, whether they were trying to quit, and how much they craved a cigarette right now (0 = no craving, 100 = intense craving). Then, participants were divided into three groups. The first group was told that they were allowed to smoke immediately after the study, the second group was told they would have to wait one hour before smoking, and the third group was told that they would have to wait five hours before smoking. During the study, all participants viewed pictures of cigarettes and rated how pleasant they felt (0 = highly unpleasant, 100 - highly pleasant). Pearson correlation 1) First, you want to know if there is a positive linear association between how many years participants had been smoking and how much they craved a cigarette. You can test this with a | Pearson correlation analysis. a) Do you need to do a one-sided or two-sided correlation analysis? Explain why. (1 point) b) What is the research hypothesis? Feel free to use either population parameters or words (2 points) c) What is the null hypothesis? Feel free to use either population parameters or words. (2 points) 2) Create a scatterplot showing the association between the duration of smoking and cigarette craving. a) Add a linear fit line and paste the scatterplot here. (1 point) b) From the scatterplot, does there appear to be a linear relationship between the duration of smoking and craving? If so, is it positive or negative? (1 point)

Step by Step Solution

There are 3 Steps involved in it

Step: 1

blur-text-image

Get Instant Access to Expert-Tailored Solutions

See step-by-step solutions with expert insights and AI powered tools for academic success

Step: 2

blur-text-image

Step: 3

blur-text-image

Ace Your Homework with AI

Get the answers you need in no time with our AI-driven, step-by-step assistance

Get Started

Recommended Textbook for

Essentials of Business Analytics

Authors: Jeffrey D. Camm, James J. Cochran, Michael J. Fry, Jeffrey W. Ohlmann, David R. Anderson

2nd edition

1305627733, 978-1305861817, 1305861817, 978-0357688960, 978-1305627734

More Books

Students also viewed these Mathematics questions