Answered step by step
Verified Expert Solution
Link Copied!

Question

1 Approved Answer

%% Lab1 Group2 %% Input parameters fc = 250; % Carrier frequency ts = 0.0001; % Sampling period fs = 1/ts; % Sampling frequency a

%% Lab1 Group2 %% Input parameters fc = 250; % Carrier frequency ts = 0.0001; % Sampling period fs = 1/ts; % Sampling frequency a = 0.8; % Modulation index %% Input parameters of Question 1 t01 = 0.1; % Maximum time value t1 = 0:ts:t01; % Time axis N1 = 1024; % FFT size f1 = fs*(-N1/2:(N1/2)-1)/N1; % Frequency axis %% Signals of Question 1 m1 = sinc(100*t1); % Message signal m1(t) mn1 = m1/(max(abs(m1))); % Normalized message signal m1n(t) c1 = cos(2*pi*fc*t1); % Carrier signal c1(t) u1 = (1+(a*mn1)).*c1; % Conventional AM signal u1(t) %% Signals of Question 2 M1 = fftshift(fft(m1,N1)); % Fourier transform of m1(t) U1 = fftshift(fft(u1,N1)); % Fourier transform of u1(t) %% Input parameters of Question 3 t02 = 0.4; % Maximum time value t2 = 0:ts:t02; % Time axis N2 = 4096; % FFT size f2 = fs*(-N2/2:(N2/2)-1)/N2; % Frequency axis %% Signals of Question 3 m2 = sinc(100*t2); % Message signal m2(t) mn2 = m2/(max(abs(m2))); % Normalized message signal m2n(t) c2 = cos(2*pi*fc*t2); % Carrier signal c2(t) u2 = (1+(a*mn2)).*c2; % Conventional AM signal u2(t) M2 = fftshift(fft(m2,N2)); % Fourier transform of m2(t) U2 = fftshift(fft(u2,N2)); % Fourier transform of u2(t) %% Plots of Question 1 figure(1) plot(t1,m1) grid on hold on plot(t1,u1) %% Plots of Question 2 figure(2) plot(f1,abs(M1)) % Magnitude plot grid onimage text in transcribed 
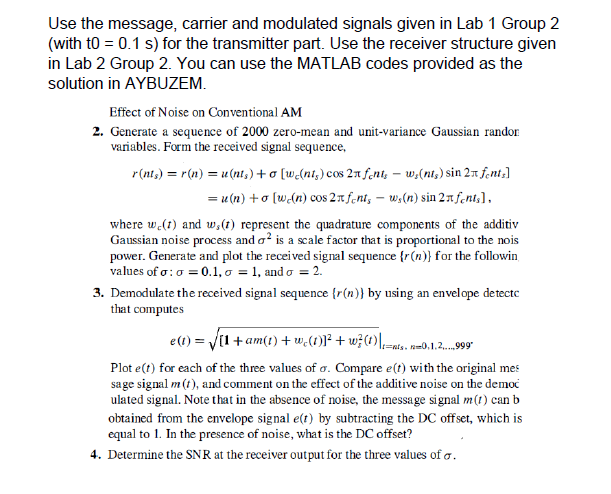
hold on plot(f1,abs(U1)) % Magnitude plot %% Plots of Question 3 figure(3) plot(t2,m2) grid on hold on plot(t2,u2) figure(4) plot(f2,abs(M2)) % Magnitude plot grid on hold on plot(f2,abs(U2)) % Magnitude plot

Use the message, carrier and modulated signals given in Lab 1 Group 2 (with t0 = 0.1 s) for the transmitter part. Use the receiver structure given in Lab 2 Group 2. You can use the MATLAB codes provided as the solution in AYBUZEM. Effect of Noise on Conventional AM 2. Generate a sequence of 2000 zero-mean and unit-variance Gaussian randor variables. Form the received signal sequence, r(nts) = r(n) = u(nts)+ [we(nt,) cos 2n fent; - w (nt) sin 2 fonte] = u(n) + 0 [we(n) cos 2Afint- ws(n) sin 2 Afonts), where we(t) and w,(t) represent the quadrature components of the additiv Gaussian noise process and o is a scale factor that is proportional to the nois power. Generate and plot the received signal sequence {r(n)} for the followin values of o: 0 = 0.1, 0 = 1, and o = 2. 3. Demodulate the received signal sequence {r(n)) by using an envelope detecte that computes e(t) = V11 + am(1) + wc(01? + w; 0)|izats. -0,1.2.999 Plot e(t) for each of the three values of o. Compare e(t) with the original mes sa ge signal m(t), and comment on the effect of the additive noise on the democ ulated signal. Note that in the absence of noise, the message signal m(t) can b obtained from the envelope signal e(t) by subtracting the DC offset, which is equal to 1. In the presence of noise, what is the DC offset? 4. Determine the SNR at the receiver output for the three values of o. Use the message, carrier and modulated signals given in Lab 1 Group 2 (with t0 = 0.1 s) for the transmitter part. Use the receiver structure given in Lab 2 Group 2. You can use the MATLAB codes provided as the solution in AYBUZEM. Effect of Noise on Conventional AM 2. Generate a sequence of 2000 zero-mean and unit-variance Gaussian randor variables. Form the received signal sequence, r(nts) = r(n) = u(nts)+ [we(nt,) cos 2n fent; - w (nt) sin 2 fonte] = u(n) + 0 [we(n) cos 2Afint- ws(n) sin 2 Afonts), where we(t) and w,(t) represent the quadrature components of the additiv Gaussian noise process and o is a scale factor that is proportional to the nois power. Generate and plot the received signal sequence {r(n)} for the followin values of o: 0 = 0.1, 0 = 1, and o = 2. 3. Demodulate the received signal sequence {r(n)) by using an envelope detecte that computes e(t) = V11 + am(1) + wc(01? + w; 0)|izats. -0,1.2.999 Plot e(t) for each of the three values of o. Compare e(t) with the original mes sa ge signal m(t), and comment on the effect of the additive noise on the democ ulated signal. Note that in the absence of noise, the message signal m(t) can b obtained from the envelope signal e(t) by subtracting the DC offset, which is equal to 1. In the presence of noise, what is the DC offset? 4. Determine the SNR at the receiver output for the three values of o

Step by Step Solution

There are 3 Steps involved in it

Step: 1

blur-text-image

Get Instant Access to Expert-Tailored Solutions

See step-by-step solutions with expert insights and AI powered tools for academic success

Step: 2

blur-text-image

Step: 3

blur-text-image

Ace Your Homework with AI

Get the answers you need in no time with our AI-driven, step-by-step assistance

Get Started

Recommended Textbook for

Fundamentals of Corporate Finance

Authors: Stephen A. Ross, Randolph W. Westerfield, Bradford D.Jordan

8th Edition

978-0073530628, 978-0077861629

Students also viewed these Databases questions

Question

10. What is meant by a feed rate?

Answered: 1 week ago