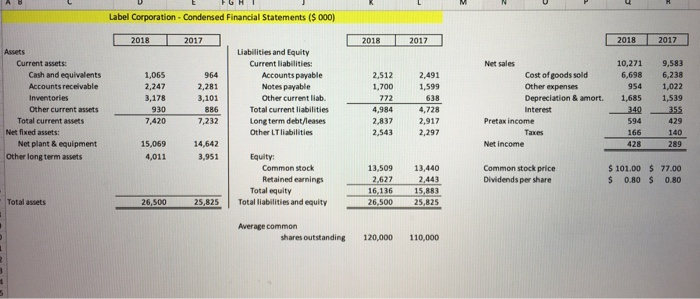
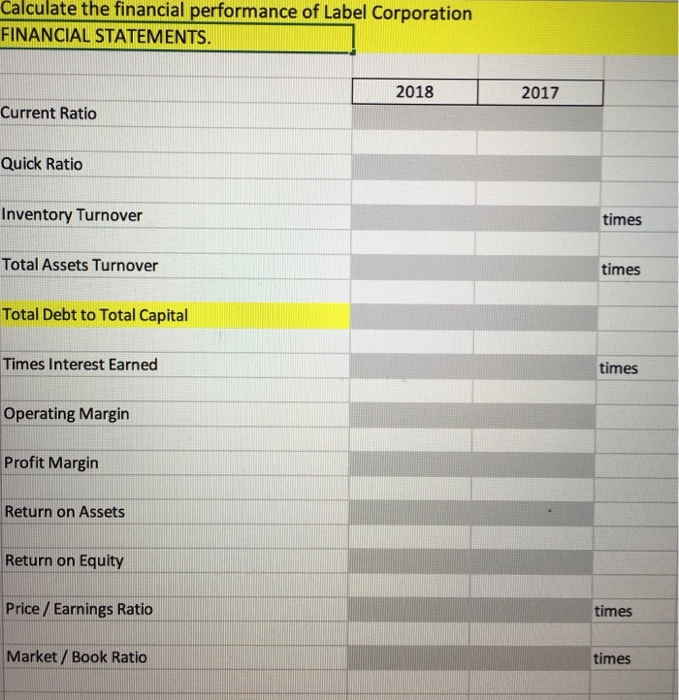
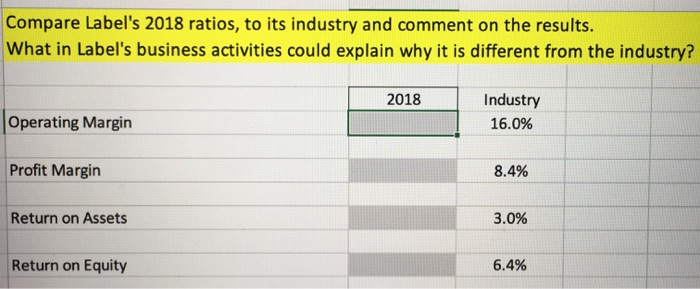
Label Corporation - Condensed Financial Statements ($ 000) 2018 2017 2018 2017 2018 2017 Assets Current assets: Cash and equivalents Accounts receivable Inventories Other current assets Total current assets Net fixed assets: Net plant & equipment Other long term assets 1,065 2,247 3,178 930 7,420 964 2,281 3,101 886 7,232 Liabilities and Equity Current liabilities: Accounts payable Notes payable Other current liab. Total current liabilities Long term debt/leases Other LT liabilities 2,512 1,700 772 4.984 2,837 2,543 2.491 1,599 638 4,728 2,917 2,297 Net sales Cost of goods sold Other expenses Depreciation & amort. Interest Pretax income Taxes Net Income 10,271 6,698 954 1,685 340 594 166 428 9,583 6.238 1,022 1,539 355 429 140 289 15,059 4,011 14,642 3,951 Equity Common stock Retained earnings Total equity Total liabilities and equity 13,509 2,627 16.136 26,500 13,440 2,443 15,883 25,825 Common stock price Dividends per share $ 101.00 $ 77.00 $ 0.80 $ 0.80 Total assets 26,500 25,825 Average common shares outstanding 120,000 110,000 Calculate the financial performance of Label Corporation FINANCIAL STATEMENTS. 2018 2017 Current Ratio Quick Ratio Inventory Turnover times Total Assets Turnover times Total Debt to Total Capital Times Interest Earned times Operating Margin Profit Margin Return on Assets Return on Equity Price / Earnings Ratio times Market / Book Ratio times USING CALCULATIONS FROM TAB 1, Compare Label's 2018 ratios, to its industry and comment on the results. What in Label's business activities could explain why it is different from the industry? 2018 Industry 1.6 Current Ratio Quick Ratio 1.0 Compare Label's 2018 ratios, to its industry and comment on the results. What in Label's business activities could explain why it is different from the industry? 2018 Industry 5.5 Inventory Turnover Total Assets Turnover 0.7 Compare Label's 2018 ratios, to its industry and comment on the results. What in Label's business activities could explain why it is different from the industry? 2018 Industry 47.5% Total Debt to Total Capital Times Interest Earned 3.80 Compare Label's 2018 ratios, to its industry and comment on the results. What in Label's business activities could explain why it is different from the industry? 2018 Industry 16.0% Operating Margin Profit Margin 8.4% Return on Assets 3.0% Return on Equity 6.4% Compare Label's 2018 ratios, to its industry and comment on the results. What in Label's business activities could explain why it is different from the industry? 2018 Industry 14.5 Price / Earnings Ratio Market / Book Ratio 1.6


