Answered step by step
Verified Expert Solution
Question
1 Approved Answer
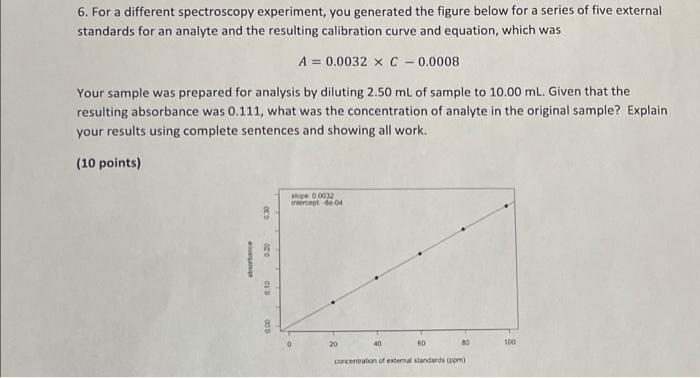
label please 6. For a different spectroscopy experiment, you generated the figure below for a series of five external standards for an analyte and the
label please 
6. For a different spectroscopy experiment, you generated the figure below for a series of five external standards for an analyte and the resulting calibration curve and equation, which was A = 0.0032 x C 1 0.0008 Your sample was prepared for analysis by diluting 2.50 mL of sample to 10.00 mL. Given that the resulting absorbance was 0.111, what was the concentration of analyte in the original sample? Explain your results using complete sentences and showing all work. (10 points) slope 0,0012 intercept de-04 20 40 60 80 100 concentration of external standards (ppm) aouegosge DED 920 0.10 0.00 
Step by Step Solution
There are 3 Steps involved in it
Step: 1

Get Instant Access to Expert-Tailored Solutions
See step-by-step solutions with expert insights and AI powered tools for academic success
Step: 2

Step: 3

Ace Your Homework with AI
Get the answers you need in no time with our AI-driven, step-by-step assistance
Get Started


