

Question
Language: Python 3.6.1 Interpreter: Anaconda 3.6.4 --- Program used: PyCharm --- Starter code: Shown below image --- --- import numpy as np def survey(arr):
Language: Python 3.6.1
Interpreter: Anaconda 3.6.4
--- Program used: PyCharm --- Starter code: Shown below image ---
 ---
---
import numpy as np
def survey(arr): """ This function takes an array of survey responses and reports back which brand has been disliked by 75% of the consumers :param arr: 2D array containing arrays of survey response for each brand :return: None """
#To do: write a code that calculate the percentage of consumers who are not satisfied by a brand in survey. #To do: write a code to display the brand number for all brands where the fraction of consumers who are not # satisfied by the brand is greater than 75%.
survey1 = [ [0, 1, 0, 1], [0, 1, 0, 0], [1, 0, 0, 1], [0, 1, 0, 1], [1, 1, 0, 1]]
survey2 = [ [0, 0, 0, 1, 0, 0, 1, 1, 1, 0], [0, 0, 0, 0, 1, 0, 1, 0, 0, 0], [0, 0, 1, 0, 1, 0, 0, 0, 1, 1], [0, 1, 0, 1, 1, 0, 0, 1, 1, 0], [0, 1, 0, 0, 1, 1, 1, 1, 1, 1], [0, 0, 0, 0, 1, 1, 0, 0, 1, 0], [0, 0, 0, 0, 0, 0, 0, 1, 1, 0], [0, 1, 0, 0, 1, 1, 0, 0, 1, 0], [0, 0, 0, 1, 1, 0, 0, 1, 1, 0], [0, 0, 0, 0, 1, 0, 0, 0, 1, 0], [0, 0, 1, 0, 1, 1, 0, 1, 1, 0], [0, 0, 0, 1, 1, 0, 0, 0, 1, 0], [0, 0, 0, 0, 0, 0, 0, 1, 1, 0], [0, 1, 0, 0, 1, 0, 0, 1, 1, 0], [0, 0, 0, 0, 0, 1, 0, 0, 0, 0], [0, 1, 0, 0, 0, 0, 0, 0, 1, 0], [0, 1, 0, 1, 0, 1, 0, 0, 0, 1], [0, 1, 0, 0, 0, 0, 0, 1, 1, 0], [1, 0, 0, 0, 1, 1, 0, 0, 0, 0], [0, 1, 0, 0, 0, 0, 0, 1, 0, 1] ]
#To do: Create a 2D array from the list of lists for each survey. #To do: Call the function for each survey
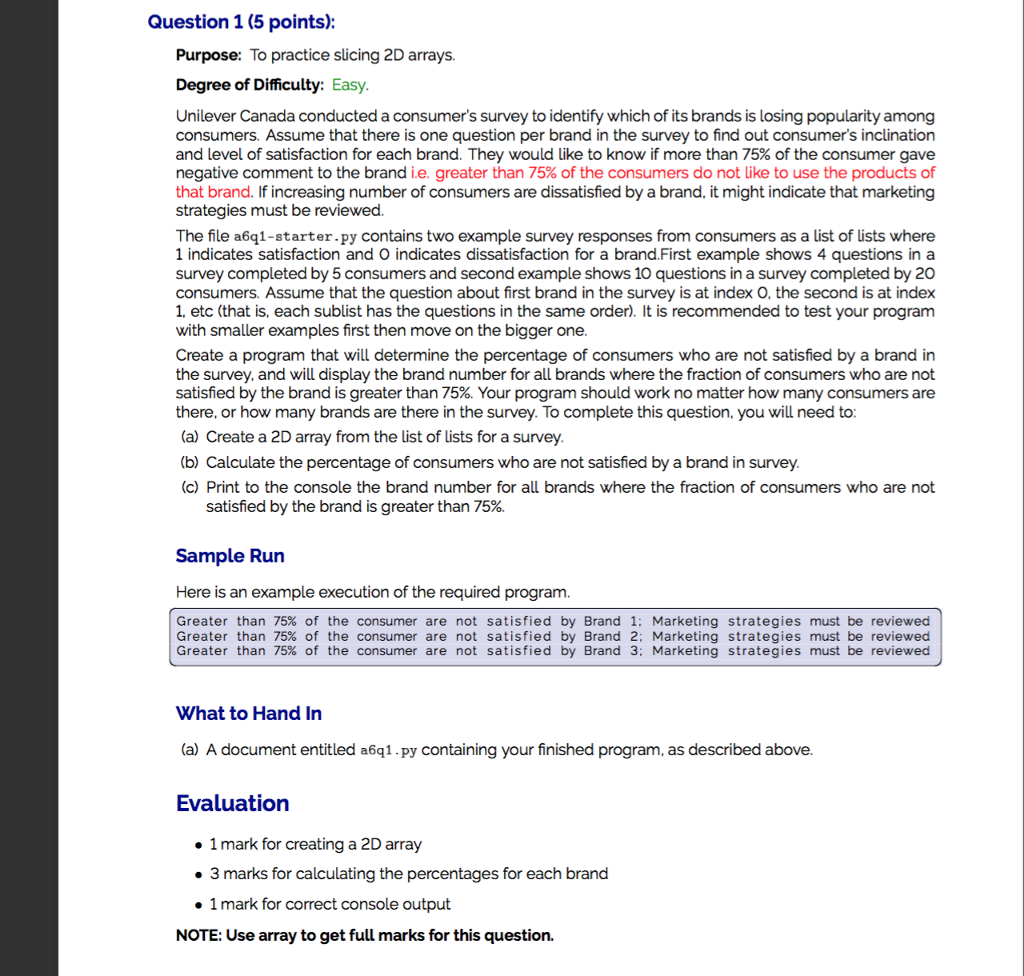
Question 1 (5 points) Purpose: To practice slicing 2D arrays. Degree of Difficulty: Easy Unilever Canada conducted a consumer's survey to identify which of its brands is losing popularity among consumers. Assume that there is one question per brand in the survey to find out consumer's inclination and level of satisfaction for each brand. They would like to know if more than 75% of the consumer gave negative comment to the brand ie. greater than 75% of the consumers do not like to use the products of that brand. If increasing number of consumers are dissatisfied by a brand, it might indicate that marketing strategies must be reviewed. The file a6q1-starter.py contains two example survey responses from consumers as a list of lists where 1 indicates satisfaction and O indicates dissatisfaction for a brand.First example shows 4 questions ina survey completed by 5 consumers and second example shows 10 questions in a survey completed by 20 consumers. Assume that the question about first brand in the survey is at index O, the second is at index 1. etc (that is, each sublist has the questions in the same order). It is recommended to test your progranm with smaller examples first then move on the bigger one Create a program that will determine the percentage of consumers who are not satisfied by a brand in the survey, and will display the brand number for all brands where the fraction of consumers who are not satisfied by the brand is greater than 75%. Your program should work no matter how many consumers are there, or how many brands are there in the survey. To complete this question, you will need to: (a) Create a 2D array from thelist of lists for a survey (b) Calculate the percentage of consumers who are not satisfied by a brand in survey (c) Print to the console the brand number for all brands where the fraction of consumers who are not satisfied by the brand is greater than 75%. Sample Run Here is an example execution of the required program. Greater than 75% of the consumer are not satisfied by Brand 1: Marketing strategies must be reviewed Greater than 75% of the consumer are not satisfied by Brand 2: Marketing strategies must be reviewed Greater than 75% of the consumer are not satisfied by Brand 3: Marketing strategies must be reviewed What to Hand In (a) A document entitled a6q1.py containing your finished program, as described above. Evaluation . 1 mark for creating a 2D array e 3 marks for calculating the percentages for each brand . 1 mark for correct console output NOTE: Use array to get full marks for this question. Question 1 (5 points) Purpose: To practice slicing 2D arrays. Degree of Difficulty: Easy Unilever Canada conducted a consumer's survey to identify which of its brands is losing popularity among consumers. Assume that there is one question per brand in the survey to find out consumer's inclination and level of satisfaction for each brand. They would like to know if more than 75% of the consumer gave negative comment to the brand ie. greater than 75% of the consumers do not like to use the products of that brand. If increasing number of consumers are dissatisfied by a brand, it might indicate that marketing strategies must be reviewed. The file a6q1-starter.py contains two example survey responses from consumers as a list of lists where 1 indicates satisfaction and O indicates dissatisfaction for a brand.First example shows 4 questions ina survey completed by 5 consumers and second example shows 10 questions in a survey completed by 20 consumers. Assume that the question about first brand in the survey is at index O, the second is at index 1. etc (that is, each sublist has the questions in the same order). It is recommended to test your progranm with smaller examples first then move on the bigger one Create a program that will determine the percentage of consumers who are not satisfied by a brand in the survey, and will display the brand number for all brands where the fraction of consumers who are not satisfied by the brand is greater than 75%. Your program should work no matter how many consumers are there, or how many brands are there in the survey. To complete this question, you will need to: (a) Create a 2D array from thelist of lists for a survey (b) Calculate the percentage of consumers who are not satisfied by a brand in survey (c) Print to the console the brand number for all brands where the fraction of consumers who are not satisfied by the brand is greater than 75%. Sample Run Here is an example execution of the required program. Greater than 75% of the consumer are not satisfied by Brand 1: Marketing strategies must be reviewed Greater than 75% of the consumer are not satisfied by Brand 2: Marketing strategies must be reviewed Greater than 75% of the consumer are not satisfied by Brand 3: Marketing strategies must be reviewed What to Hand In (a) A document entitled a6q1.py containing your finished program, as described above. Evaluation . 1 mark for creating a 2D array e 3 marks for calculating the percentages for each brand . 1 mark for correct console output NOTE: Use array to get full marks for thisStep by Step Solution
There are 3 Steps involved in it
Step: 1

Get Instant Access to Expert-Tailored Solutions
See step-by-step solutions with expert insights and AI powered tools for academic success
Step: 2

Step: 3
Ace Your Homework with AI
Get the answers you need in no time with our AI-driven, step-by-step assistance
Get Started
Harness The Power Of Big Data The IBM Big Data Platform
Authors: Paul Zikopoulos, David Corrigan James Giles Thomas Deutsch Krishnan Parasuraman Dirk DeRoos Paul Zikopoulos
1st Edition
0071808183, 9780071808187