

Answered step by step
Verified Expert Solution
Question
1 Approved Answer
Lapse Table Year 1 Year 2+ 5% 2% 16 Product Features Sum Insured (RM) 10,000 Average Premium (RM) 362.825 Entry Age Death 100% Accidental Death
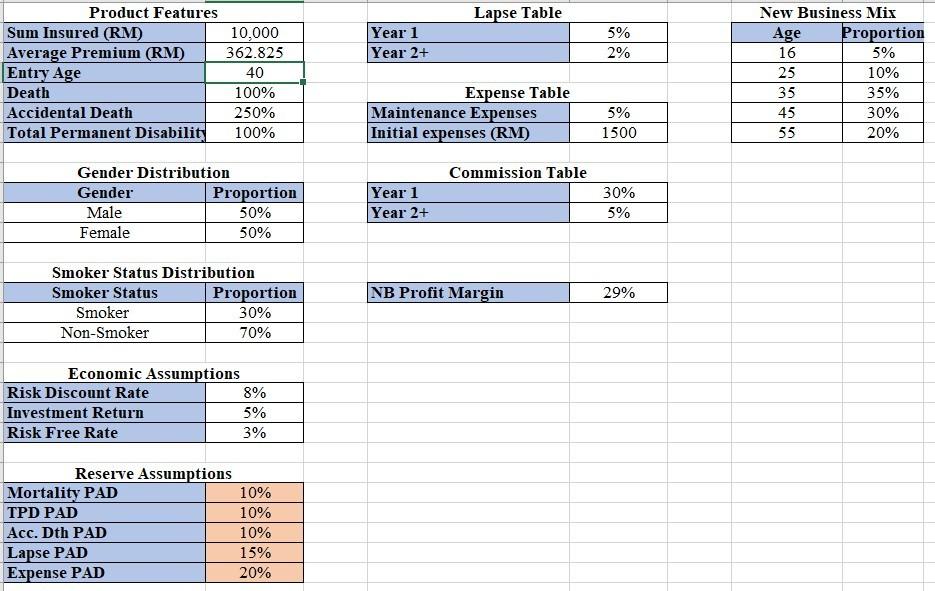
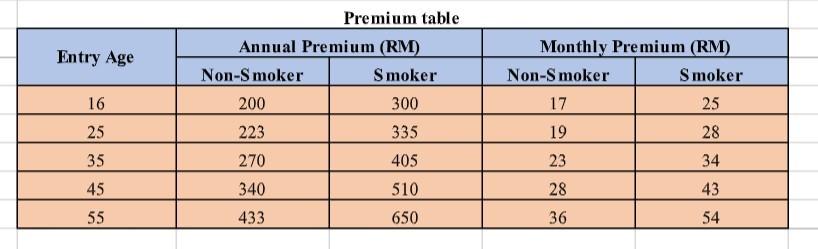
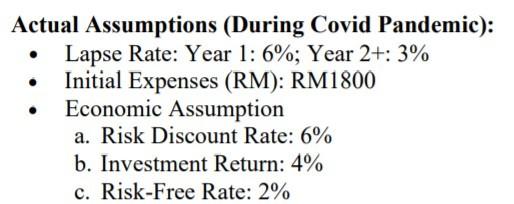
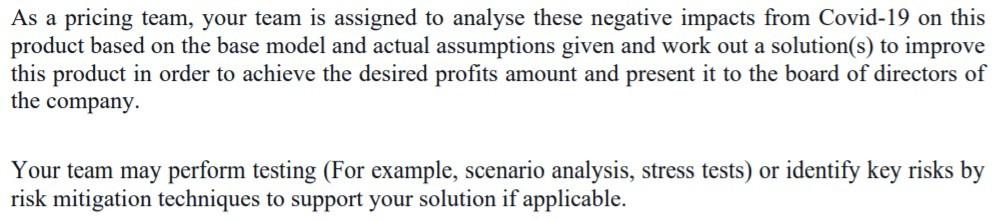
Lapse Table Year 1 Year 2+ 5% 2% 16 Product Features Sum Insured (RM) 10,000 Average Premium (RM) 362.825 Entry Age Death 100% Accidental Death 250% Total Permanent Disability 100% 40 New Business Mix Age Proportion 5% 25 10% 35 35% 45 30% 55 20% Expense Table Maintenance Expenses Initial expenses (RM) 5% 1500 Commission Table Gender Distribution Gender Proportion Male 50% Female 50% Year 1 Year 2+ 30% 5% NB Profit Margin 29% Smoker Status Distribution Smoker Status Proportion Smoker 30% Non-Smoker 70% Economic Assumptions Risk Discount Rate 8% Investment Return 5% Risk Free Rate 3% Reserve Assumptions Mortality PAD 10% TPD PAD 10% Acc. Dth PAD 10% Lapse PAD 15% Expense PAD 20% Entry Age Premium table Annual Premium (RM) Non-Smoker Smoker 200 300 Monthly Premium (RM) Non-Smoker Smoker 17 25 16 25 335 19 28 223 270 35 405 23 34 43 45 340 510 28 55 433 650 36 54 . Actual Assumptions (During Covid Pandemic): Lapse Rate: Year 1: 6%; Year 2+: 3% Initial Expenses (RM): RM1800 Economic Assumption a. Risk Discount Rate: 6% b. Investment Return: 4% c. Risk-Free Rate: 2% As a pricing team, your team is assigned to analyse these negative impacts from Covid-19 on this product based on the base model and actual assumptions given and work out a solution(s) to improve this product in order to achieve the desired profits amount and present it to the board of directors of the company. Your team may perform testing (For example, scenario analysis, stress tests) or identify key risks by risk mitigation techniques to support your solution if applicable. Lapse Table Year 1 Year 2+ 5% 2% 16 Product Features Sum Insured (RM) 10,000 Average Premium (RM) 362.825 Entry Age Death 100% Accidental Death 250% Total Permanent Disability 100% 40 New Business Mix Age Proportion 5% 25 10% 35 35% 45 30% 55 20% Expense Table Maintenance Expenses Initial expenses (RM) 5% 1500 Commission Table Gender Distribution Gender Proportion Male 50% Female 50% Year 1 Year 2+ 30% 5% NB Profit Margin 29% Smoker Status Distribution Smoker Status Proportion Smoker 30% Non-Smoker 70% Economic Assumptions Risk Discount Rate 8% Investment Return 5% Risk Free Rate 3% Reserve Assumptions Mortality PAD 10% TPD PAD 10% Acc. Dth PAD 10% Lapse PAD 15% Expense PAD 20% Entry Age Premium table Annual Premium (RM) Non-Smoker Smoker 200 300 Monthly Premium (RM) Non-Smoker Smoker 17 25 16 25 335 19 28 223 270 35 405 23 34 43 45 340 510 28 55 433 650 36 54 . Actual Assumptions (During Covid Pandemic): Lapse Rate: Year 1: 6%; Year 2+: 3% Initial Expenses (RM): RM1800 Economic Assumption a. Risk Discount Rate: 6% b. Investment Return: 4% c. Risk-Free Rate: 2% As a pricing team, your team is assigned to analyse these negative impacts from Covid-19 on this product based on the base model and actual assumptions given and work out a solution(s) to improve this product in order to achieve the desired profits amount and present it to the board of directors of the company. Your team may perform testing (For example, scenario analysis, stress tests) or identify key risks by risk mitigation techniques to support your solution if applicable
Step by Step Solution
There are 3 Steps involved in it
Step: 1

Get Instant Access to Expert-Tailored Solutions
See step-by-step solutions with expert insights and AI powered tools for academic success
Step: 2

Step: 3
Ace Your Homework with AI
Get the answers you need in no time with our AI-driven, step-by-step assistance
Get Started
Lectures On Public Economics
Authors: Anthony B. Atkinson, Joseph E. Stiglitz
1st Edition
0691166412, 978-0691166414