Answered step by step
Verified Expert Solution
Question
1 Approved Answer
Lavon Lake Marina INCOME STATEMENT Last Year NET SALES 432 COST OF GOOD SOLD 175 Gross Profit 257 Other 20 Depreciation EBIT 212 Interest 30
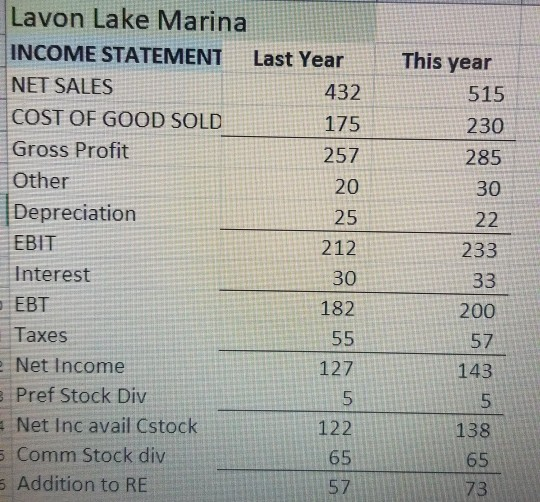
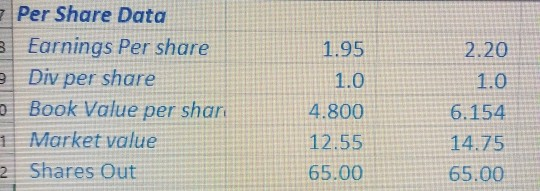
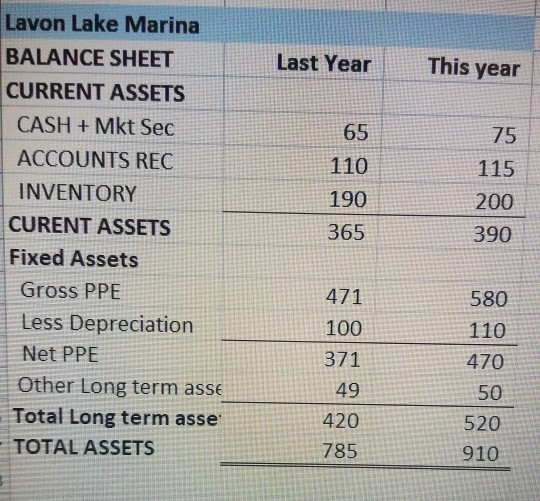
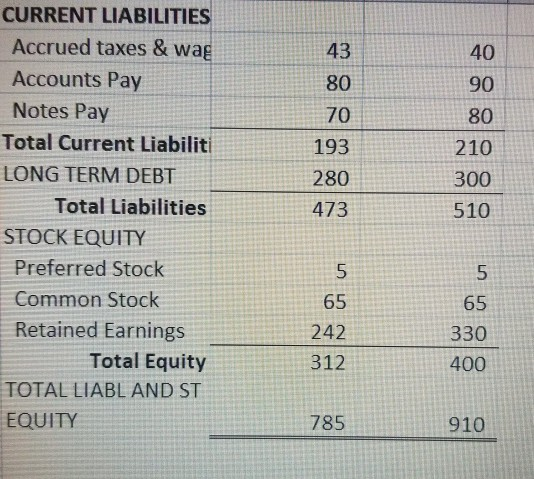
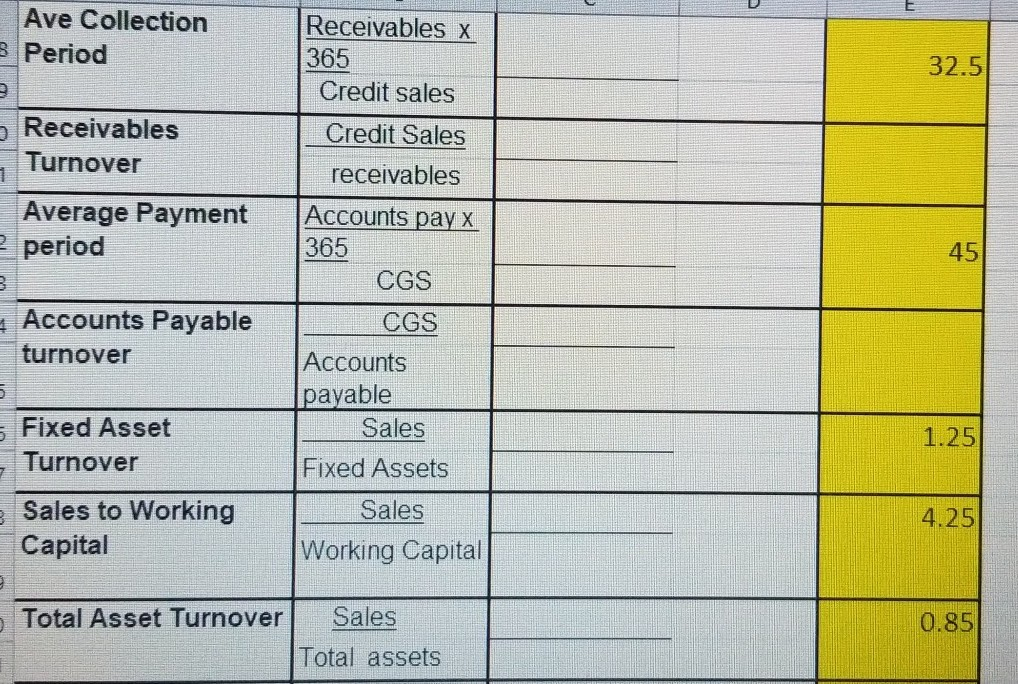
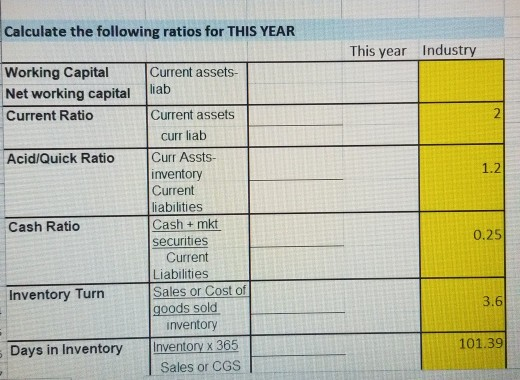
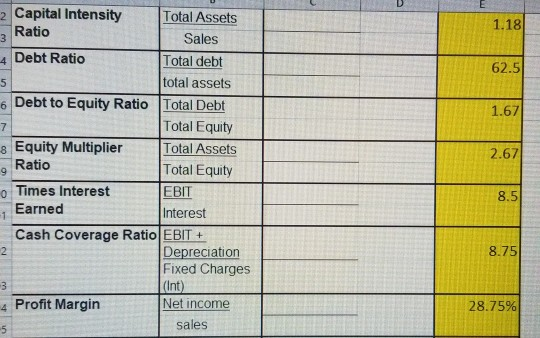
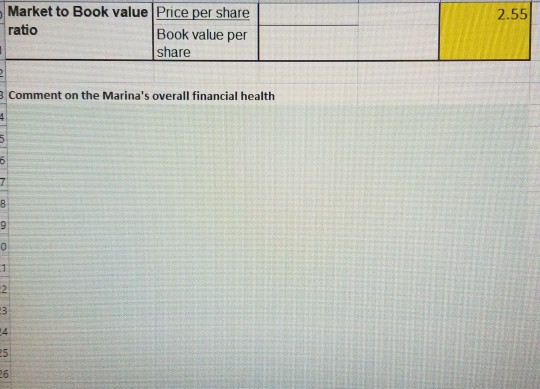
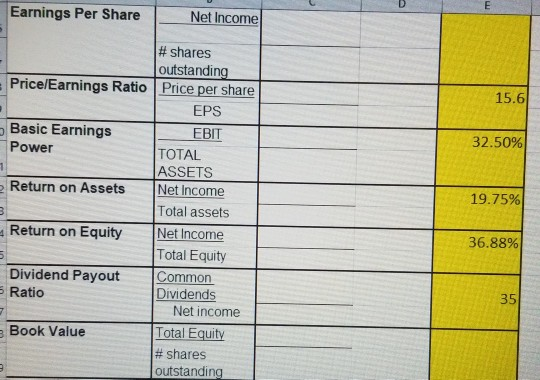
Lavon Lake Marina INCOME STATEMENT Last Year NET SALES 432 COST OF GOOD SOLD 175 Gross Profit 257 Other 20 Depreciation EBIT 212 Interest 30 EBT 182 Taxes Net Income Pref Stock Div Net Inc avail Cstock 122 Comm Stock div Addition to RE This year 515 230 285 30 22 233 25 33 200 55 57 143 127 5 138 65 65 5 Per Share Data 3 Earnings Per share Div per share Book Value per shari Market value 2 Shares Out 1.95 1.0 4.800 12.55 65.00 2.20 1.0 6.154 14.75 65.00 Last Year This year Lavon Lake Marina BALANCE SHEET CURRENT ASSETS CASH + Mkt Sec ACCOUNTS REC INVENTORY CURENT ASSETS Fixed Assets Gross PPE Less Depreciation Net PPE Other Long term asse Total Long term asse TOTAL ASSETS 65 110 190 365 75 115 200 390 471 100 371 580 110 470 49 50 420 785 520 910 40 80 90 80 210 70 193 280 473 300 510 CURRENT LIABILITIES Accrued taxes & wag Accounts Pay Notes Pay Total Current Liabiliti LONG TERM DEBT Total Liabilities STOCK EQUITY Preferred Stock Common Stock Retained Earnings Total Equity TOTAL LIABL AND ST EQUITY 65 65 330 242 312 400 785 910 Ave Collection 3 Period 32.5 Receivables Turnover Average Payment 2 period B Receivables x 365 Credit sales Credit Sales receivables Accounts pay x 365 CGS CGS Accounts payable Sales Fixed Assets Sales Working Capita Accounts Payable turnover 1.25 Fixed Asset Turnover 4.25 Sales to Working Capital Total Asset Turnover 0.85 Sales Total assets Calculate the following ratios for THIS YEAR This year Industry Working Capital Net working capital Current Ratio Acid/Quick Ratio Current assets- liab Current assets curr liab Curr Assts- inventory Current liabilities Cash + mkt securities Current Liabilities Sales or Cost of goods sold inventory Cash Ratio 0.25 Inventory Turn Days in Inventory 101.39 Sales or CGS 1.18 62.51 1.67 2.67 2 Capital Intensity Total Assets Ratio Sales 4 Debt Ratio Total debt total assets 16 Debt to Equity Ratio Total Debt Total Equity & Equity Multiplier Total Assets Ratio Total Equity Times Interest |EBIT Earned Interest Cash Coverage Ratio EBIT + Depreciation Fixed Charges (Int) Profit Margin Net income sales 8.5 8.75 28.75% 2.55 Market to Book value Price per share ratio Book value per share 3 Comment on the Marina's overall financial health ml NOS Earnings Per Share Net Income Price/Earnings Ratio 15.6 Basic Earnings Power 32.50% Return on Assets 19.75% # shares outstanding Price per share EPS EBIT TOTAL ASSETS Net Income Total assets Net Income Total Equity Common Dividends Net income Total Equity # shares Outstanding Return on Equity 36.88% Dividend Payout Ratio Book Value
Step by Step Solution
There are 3 Steps involved in it
Step: 1

Get Instant Access to Expert-Tailored Solutions
See step-by-step solutions with expert insights and AI powered tools for academic success
Step: 2

Step: 3

Ace Your Homework with AI
Get the answers you need in no time with our AI-driven, step-by-step assistance
Get Started


