

Answered step by step
Verified Expert Solution
Question
1 Approved Answer
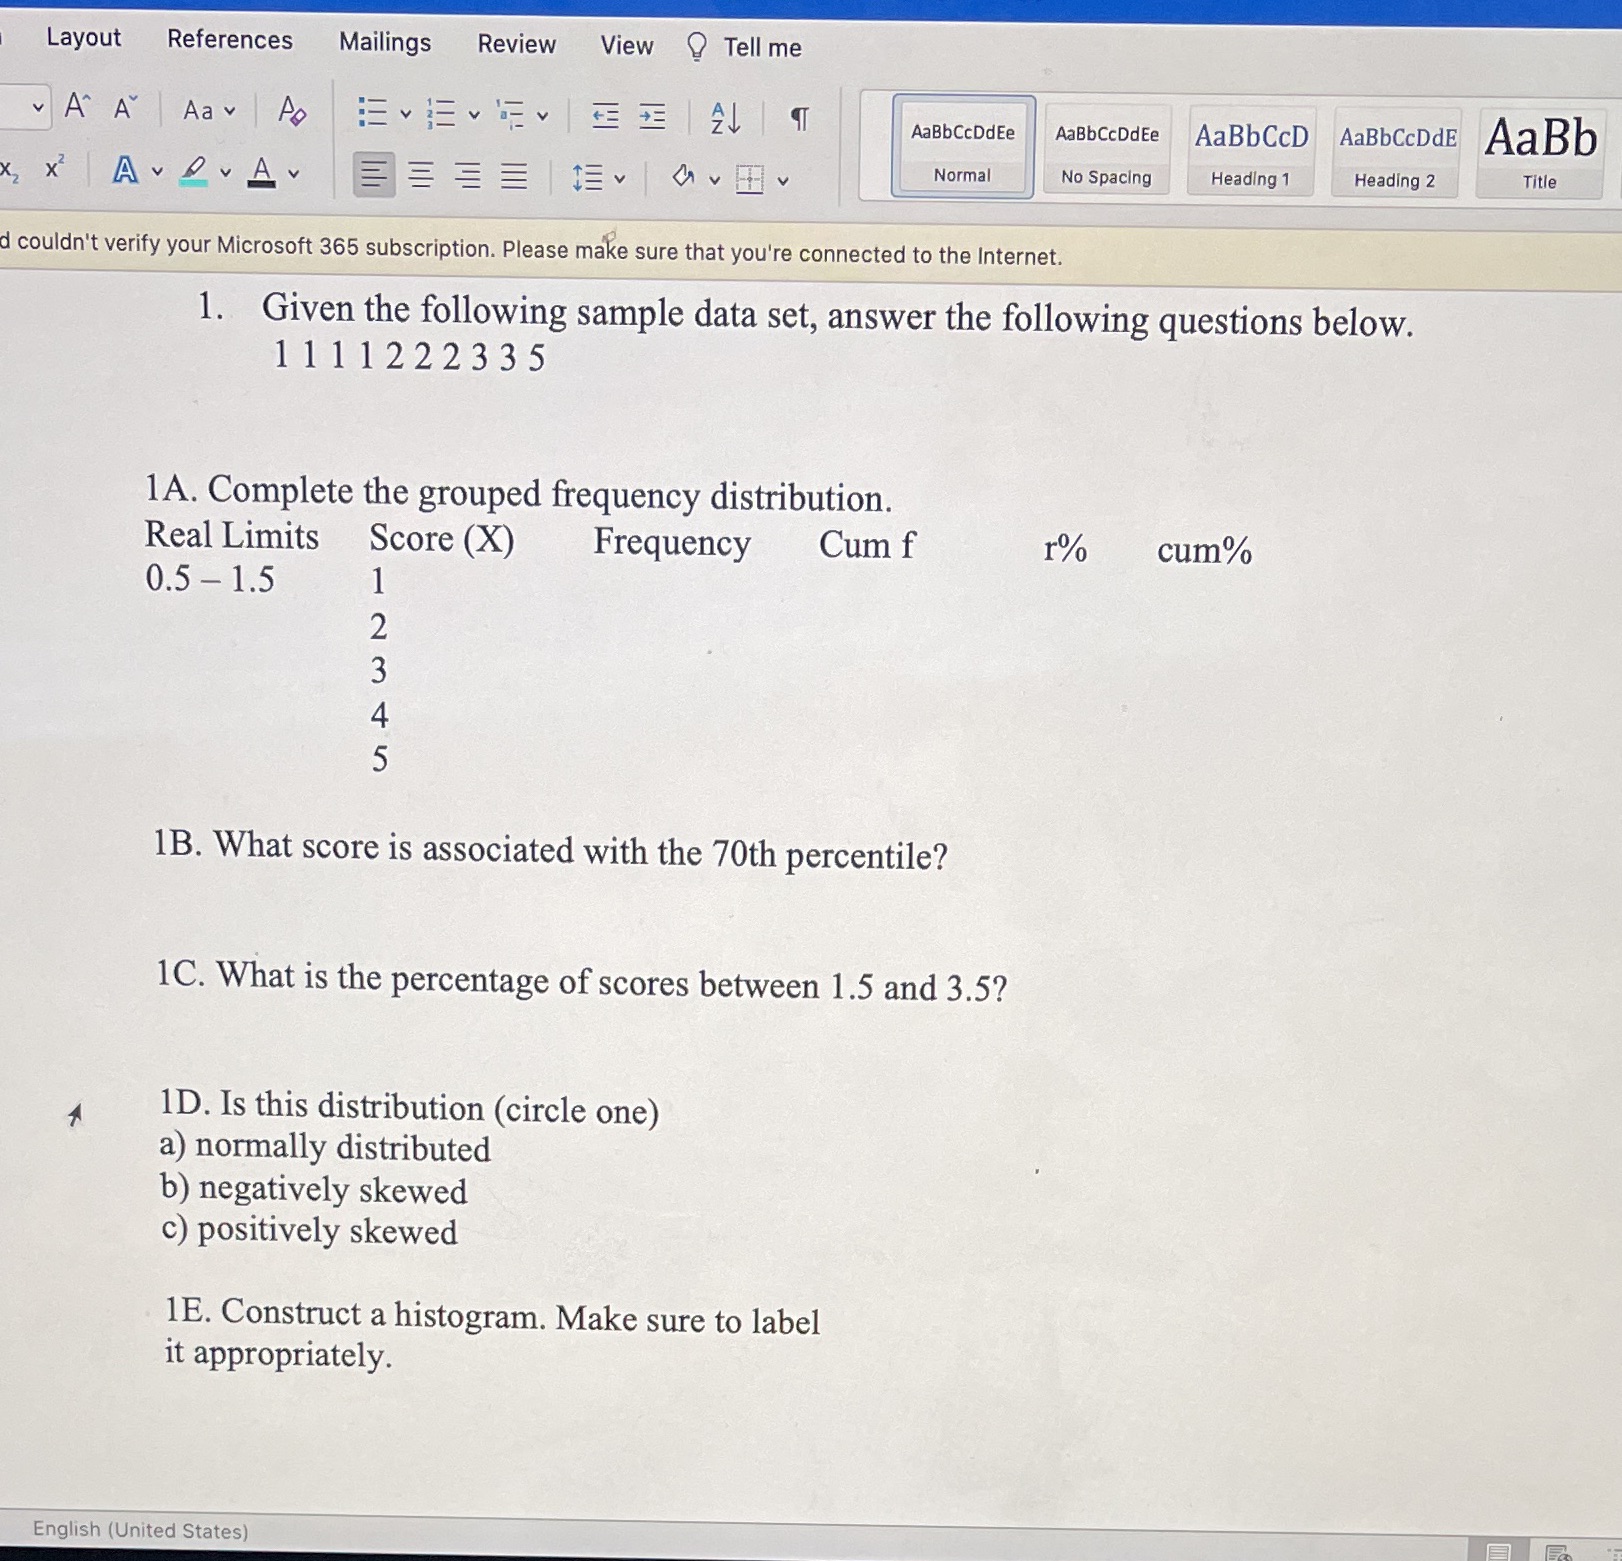
Layout References Mailings Review View Tell me A A Aa A AaBbCcDdEe AaBbCcDdEe AaBbCCD AaBbCcDdE AaBb Normal No Spacing Heading 1 Heading 2 Title d
Step by Step Solution
There are 3 Steps involved in it
Step: 1

Get Instant Access to Expert-Tailored Solutions
See step-by-step solutions with expert insights and AI powered tools for academic success
Step: 2

Step: 3
Ace Your Homework with AI
Get the answers you need in no time with our AI-driven, step-by-step assistance
Get Started
Mathematical Analysis For Quantitative Finance
Authors: Daniele Ritelli, Giulia Spaletta
1st Edition
1351245104, 9781351245104