Question
Learn on the go Open in appSkip to main content EN-GB SECTION IPerform an appropriate hypothesis test for these three questions using =.10. Show all
Learn on the go
Open in appSkip to main content
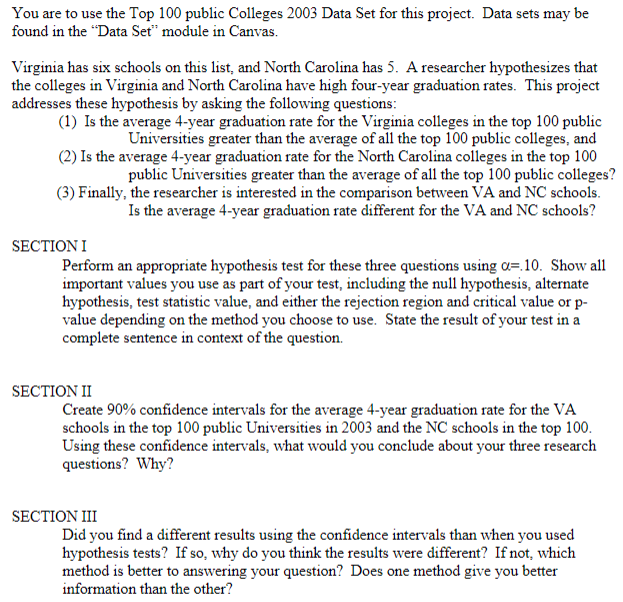
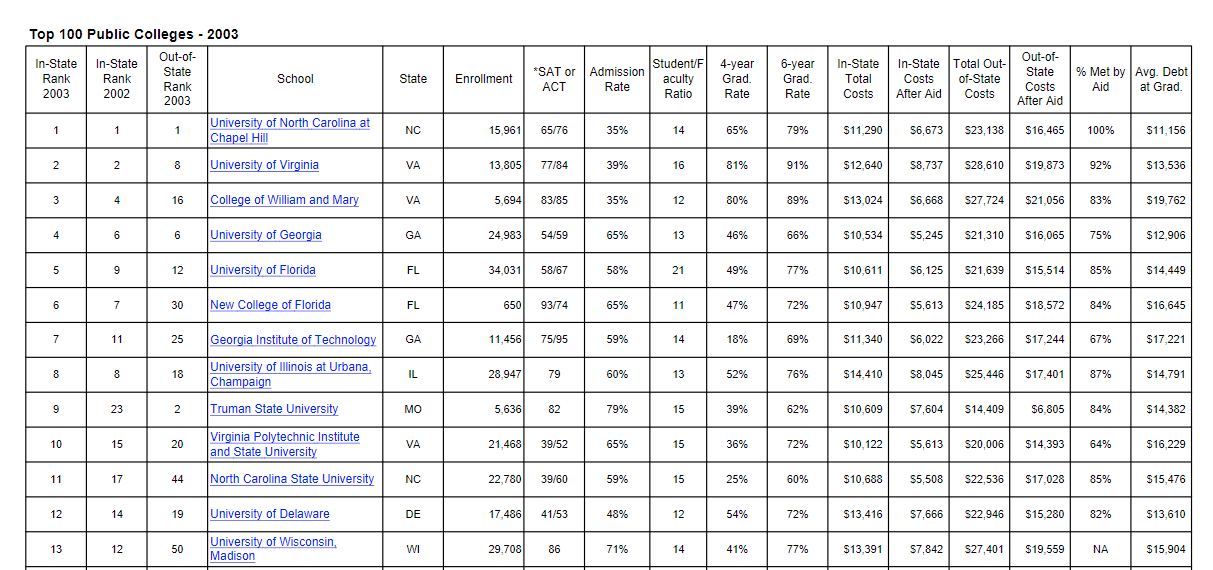
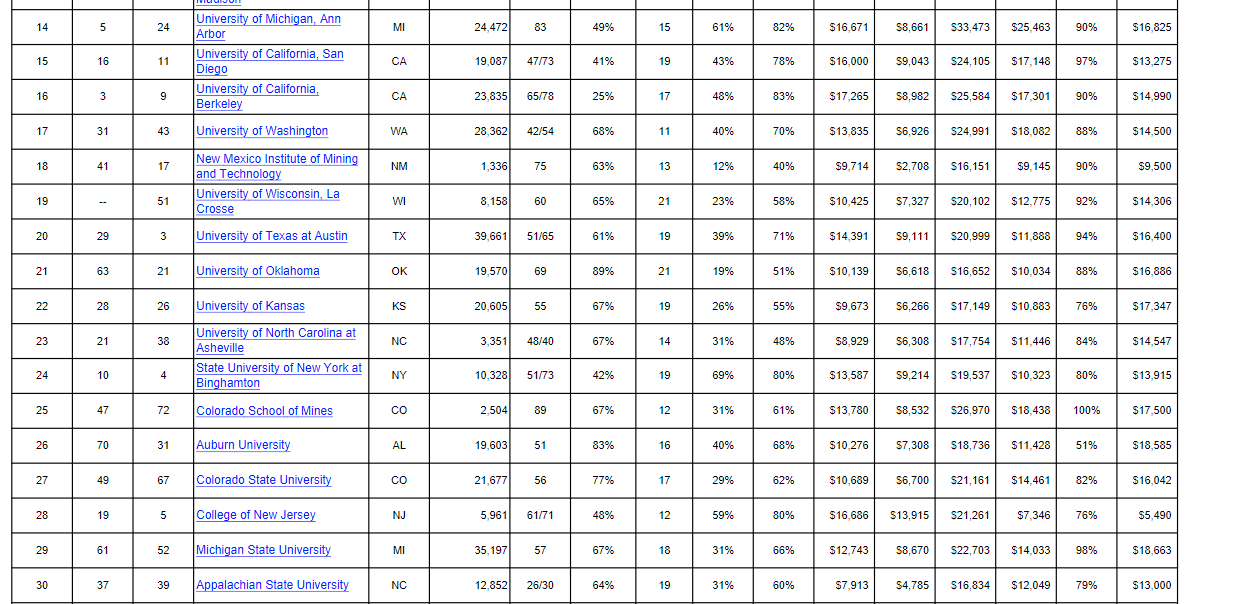
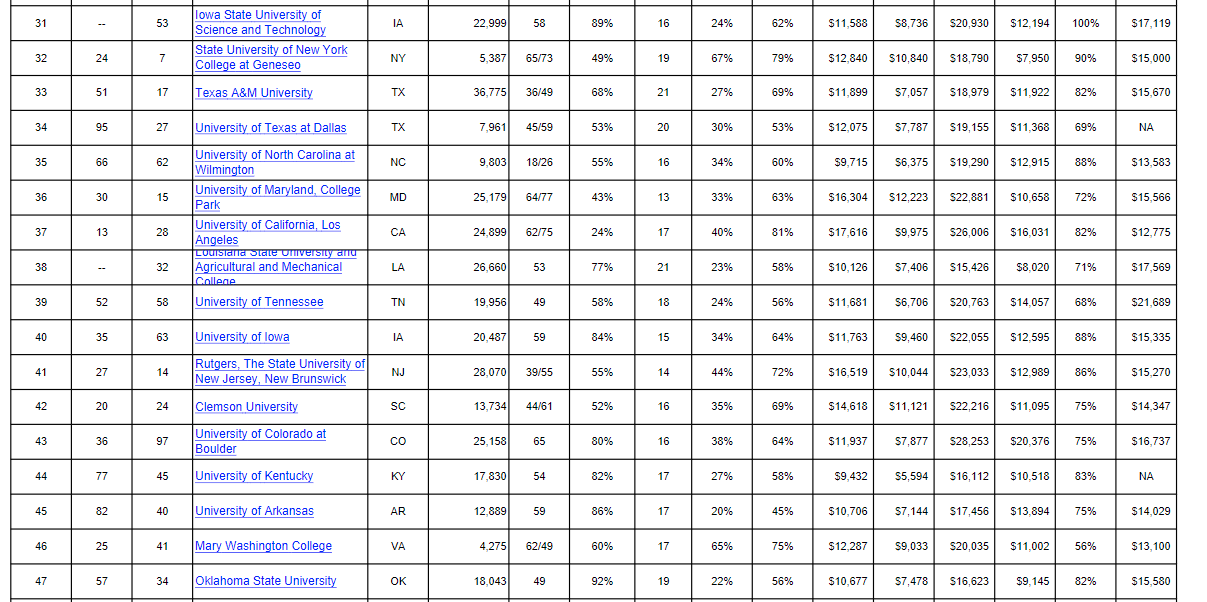
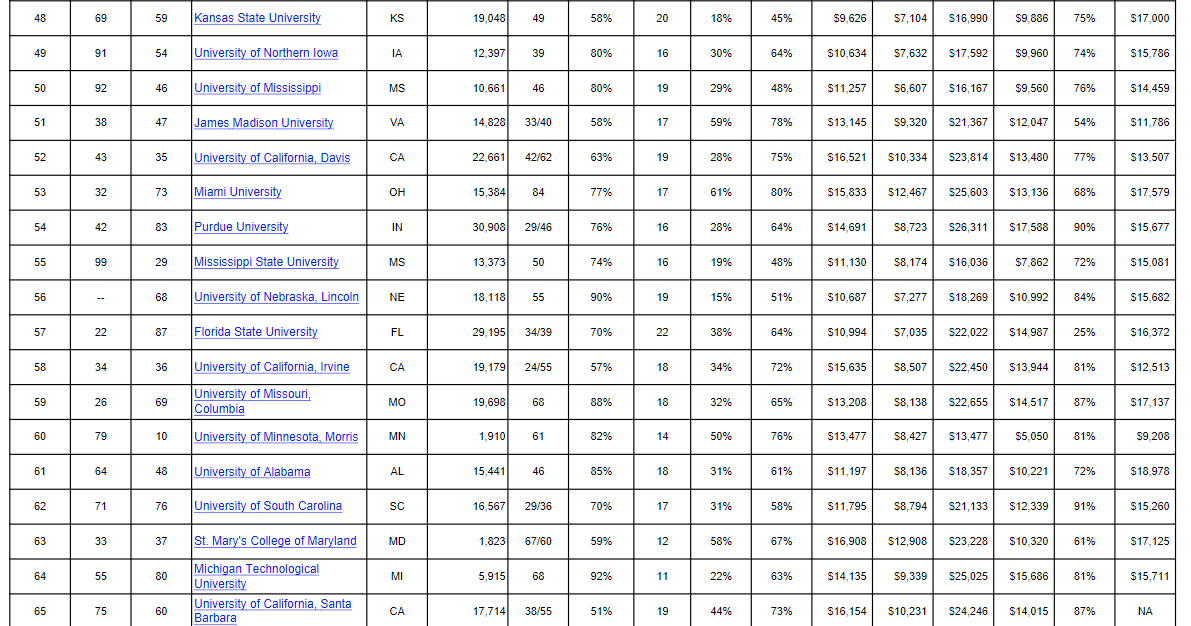
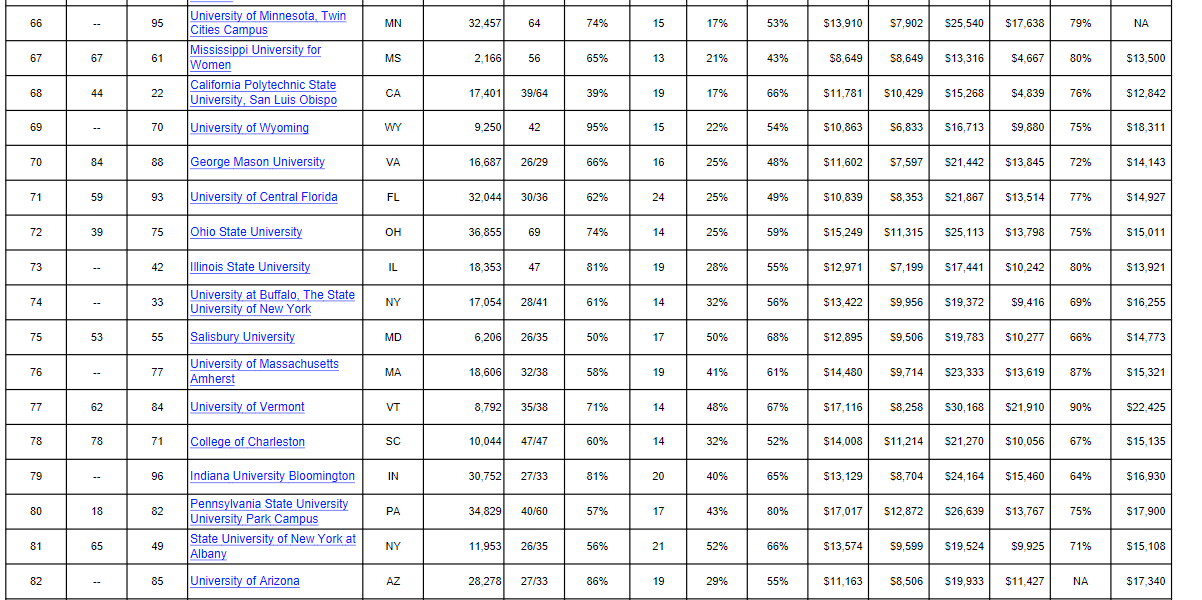
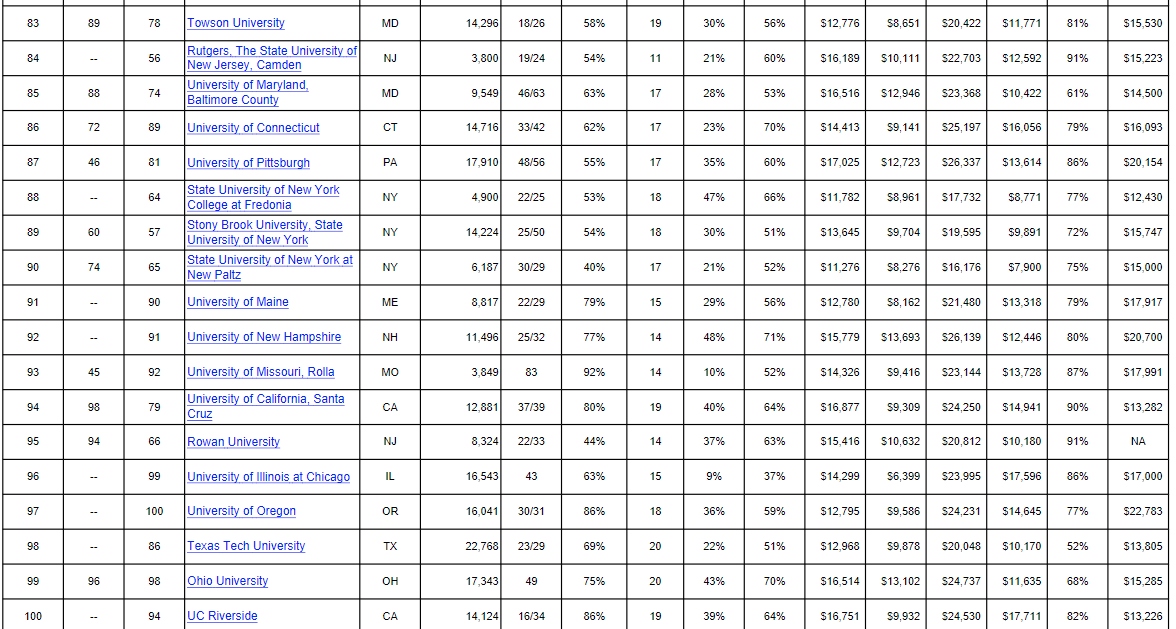
You are to use the Top 100 public Colleges 2003 Data Set for this project. Data sets may be found in the "Data Set" module in Canvas. Virginia has six schools on this list, and North Carolina has 5. A researcher hypothesizes that the colleges in Virginia and North Carolina have high four-year graduation rates. This project addresses these hypothesis by asking the following questions: (1) Is the average 4-year graduation rate for the Virginia colleges in the top 100 public Universities greater than the average of all the top 100 public colleges, and (2) Is the average 4-year graduation rate for the North Carolina colleges in the top 100 public Universities greater than the average of all the top 100 public colleges? (3) Finally, the researcher is interested in the comparison between VA and NC schools. Is the average 4-year graduation rate different for the VA and NC schools? SECTIONI Perform an appropriate hypothesis test for these three questions using a= 10. Show all important values you use as part of your test, including the null hypothesis, alternate hypothesis, test statistic value, and either the rejection region and critical value or p- value depending on the method you choose to use. State the result of your test in a complete sentence in context of the question. SECTION II Create 90% confidence intervals for the average 4-year graduation rate for the VA schools in the top 100 public Universities in 2003 and the NC schools in the top 100. Using these confidence intervals, what would you conclude about your three research questions? Why? SECTION III Did you find a different results using the confidence intervals than when you used hypothesis tests? If so, why do you think the results were different? If not, which method is better to answering your question? Does one method give you better information than the other? Top 100 Public Colleges - 2003 In-State In-State Out-of- State Rank Rank 2003 2002 Rank 2003 School State Enrollment *SAT or ACT Student/F Admission Rate aculty Ratio 4-year Grad. Rate 6-year Grad Rate In-State Total Costs In-State Total Out- Costs of-State After Aid Costs Out-of- State Costs After Aid % Met by Avg. Debt Aid at Grad. 1 1 1 1 University of North Carolina at Chapel Hill NC 15,961 65/76 35% 14 65% 79% $11.290 S6,673 S23,138 $16,465 100% $11,156 2 2 8 University of Virginia VA 13,805 77/84 39% 16 81% 91% $12.640 $8,737 $28,610 $19,873 92% $13,536 3 4 4 16 College of William and Mary VA 5,694 83/85 35% 12 80% 89% $13,024 S6,668 $27,724 $21,056 83% $19,762 4 6 6 University of Georgia GA 24.983 54/59 65% 13 46% 66% $10.534 $5,245 S21,310 $16.065 75% $12.906 5 9 12 University of Florida FL 34,031 58/67 58% 21 49% 77% $10.611 S6,125 $21.639 $15,514 85% $14,449 6 7 30 New College of Florida FL 650 93/74 65% 11 47% 72% $10.947 $5,613 S24.185 $18,572 84% $16,645 7 7 11 25 Georgia Institute of Technology GA 11,456 75/95 59% 14 18% 69% $11.340 S6,022 S23.266 $17.244 67% $17,221 8 8 18 University of Illinois at Urbana, Champaign IL 28,947 79 60% 13 52% 76% $14.410 $8,045 $25,446 $17.401 87% $14,791 9 23 2 Truman State University MO 5.636 82 79% 15 39% 62% $10,609 $7,604 S14,409 $6,805 84% $14,382 10 15 20 Virginia Polytechnic Institute and State University VA 21,468 39/52 65% 15 36% 72% $10,122 $5,613 $20,006 $14,393 64% $16.229 11 17 44 North Carolina State University NC 22.780 39/60 59% 15 25% 60% $10,688 $5,508 $22.536 $17.028 85% $15,476 12 14 19 University of Delaware DE 17,486 41/53 48% 12 54% 72% $13,416 $7,666 $22.946 $15 280 82% $13,610 13 12 50 University of Wisconsin, Madison WI 29.708 86 71% 1% 14 41% 77% % $13,391 $7,842 S27,401 $19,559 NA $15.904 14 5 24 MI 24.472 83 49% 15 61% 82% $16,671 $8,661 $33,473 $25,463 90% $16,825 15 16 11 University of Michigan, Ann Arbor University of California, San Diego University of California, Berkeley CA 19.087 47173 41% 19 43% 78% $16.000 59,043 S24,105 $17.148 97% $13,275 16 3 9 CA 23.835 65/78 25% 48% 83% $17,265 S8,982 $25,584 $17,301 90% $14.990 17 31 43 University of Washington WA 28.362 42/54 68% 11 40% 70% $13,835 $6,926 $24.991 $18.082 88% $14.500 18 41 17 NM 1,336 75 63% 13 12% 40% $9.714 $2,708 S16, 151 S9.145 90% $9,500 New Mexico Institute of Mining and Technology University of Wisconsin, La Crosse 19 51 WI 8,158 60 65% 21 23% 58% $10,425 $7,327 S20,102 $12.775 92% $14,306 20 29 3 University of Texas at Austin TX 39.661 51/65 61% 19 39% 71% $14,391 $9,111 $20.999 $11.888 94% $16,400 21 63 21 University of Oklahoma OK 19.570 69 89% 21 19% 51% $10,139 S6,618 $16.652 $10.034 88% $16.886 22 28 26 University of Kansas KS 20.605 55 67% 19 26% 55% $9.673 S6,266 $17.149 $10.883 76% $17,347 23 21 38 NC 3,351 48/40 67% 14 31% 48% $8.929 S6,308 $17,754 $11.446 84% $14,547 University of North Carolina at Asheville State University of New York at Binghamton 24 10 4 NY 10,328 51/73 42% 19 69% 80% $13,587 $9.214 $19.537 $10.323 80% $13.915 25 47 72 Colorado School of Mines CO 2.504 89 67% 12 31% 61% $13,780 S8,532 $26.970 $18,438 100% $17.500 26 70 31 Auburn University AL 19,603 51 83% 16 40% 68% $10.276 $7,308 $18,736 $11,428 51% $18,585 27 49 67 Colorado State University CO 21,677 56 77% 17 29% 62% $10,689 S6,700 S21.161 $14.461 82% $16.042 28 19 5 College of New Jersey NJ 5.961 61/71 48% 12 59% 80% $16.686 $13,915 $21,261 $7,346 76% $5,490 29 61 52 Michigan State University MI 35,197 57 67% 18 31% 66% $12,743 S8,670 $22.703 $14.033 98% $18,663 30 37 39 Appalachian State University NC 12.852 26/30 64% 19 31% 60% $7,913 $4,785 S16,834 $12.049 79% $13,000 31 12,1 53 IA 22.999 58 89% 16 24% 62% $11,588 $8,736 $20.930 $12.194 100% $17,119 Iowa State University of Science and Technology State University of New York College at Geneseo 32 24 7 NY 5.387 65/73 49% 19 67% 79% $12.840 S10,840 $18,790 $7.950 90% $15,000 33 51 17 Texas A&M University TX 36.775 36/49 68% 21 27% 69% $11.899 $7,057 $18.979 $11,922 82% $15.670 34 95 27 University of Texas at Dallas TX 7.961 45/59 53% 20 30% 53% $12.075 $7,787 S19, 155 $11,368 69% NA 35 66 62 NC 9.803 18/26 55% 16 34% 60% $9,715 S6,375 $19.290 $12.915 88% $13,583 36 30 15 MD 25,179 64/77 43% 13 33% 63% $16,304 $12,223 $22.881 $10.658 72% $15,566 University of North Carolina at Wilmington University of Maryland, College Park University of California, Los Angeles Louisiana State University and Agricultural and Mechanical College 37 13 28 CA 24,899 62/75 24% 17 40% 81% $17.616 $9,975 S26,006 $16.031 82% $12.775 38 32 LA 26,660 53 77% 21 23% 58% $10,126 $7,406 S15,426 $8.020 71% $17,569 49 39 52 58 University of Tennessee TN 19.956 49 58% 18 24% 56% $11,681 S6,706 $20,763 $14.057 68% $21,689 40 35 63 University of lowa IA 20,487 59 84% 15 34% 64% $11.763 59,460 $22.055 $12.595 88% $15,335 41 27 14 Rutgers, The State University of New Jersey, New Brunswick NJ 28.070 39/55 55% 14 44% 72% $16,519 $10,044 $23,033 $12.989 86% $15,270 42 20 24 Clemson University SC 13.734 44/61 52% 16 35% 69% $14,618 $11,121 $22.216 $11,095 75% $14,347 43 36 97 University of Colorado at Boulder со 25,158 65 80% 16 38% 64% $11,937 $7,877 S28,253 $20.376 75% $16,737 44 77 45 University of Kentucky KY 17,830 54 82% 17 27% 58% $9.432 S5,594 S16,112 $10.518 83% NA 59 45 82 40 University of Arkansas AR 12.889 59 86% 17 20% 45% $10.706 $7,144 $17,456 $13.894 75% $14.029 46 25 41 Mary Washington College VA 4,275 62/49 60% 17 65% 75% $12,287 $9,033 $20,035 $11,002 56% $13,100 47 57 37 34 Oklahoma State University OK 18,043 49 49 92% 19 22% 56% $10,677 $7,478 $16.623 $9,145 82% $15,580 48 69 59 KS Kansas State University KS 19.048 49 58% 20 18% 45% $9.626 S7,104 $16.990 $9.886 75% $17,000 49 91 54 University of Northern Iowa IA 12,397 39 80% 16 30% 64% $10,634 $7,632 $17,592 $9.960 74% $15,786 50 92 46 University of Mississippi MS 10,661 46 80% 19 29% 48% $11,257 S6,607 $16, 167 $9,560 76% $14,459 51 38 47 James Madison University VA 14,828 33/40 58% 17 59% 78% $13,145 $9,320 $21,367 $12.047 54% $11,786 52 43 35 University of California, Davis CA 22.661 42/62 63% 19 28% 75% $16.521 $10,334 S23.814 $13.480 77% $13,507 53 32 73 Miami University OH 15,384 84 77% 17 61% 80% $15,833 $12,467 S25,603 $13,136 68% $17,579 54 42 83 Purdue University IN 30.908 29/46 76% 16 28% 64% $14,691 S8,723 $26.311 $17.588 90% $15,677 55 99 29 Mississippi State University MS 13,373 50 74% 16 19% 48% $11,130 S8,174 S16,036 $7.862 72% % $15,081 56 68 University of Nebraska, Lincoln NE 18,118 55 90% 19 15% 51% $10,687 $7,277 S18,269 $10.992 84% $15,682 57 22 87 Florida State University FL 29,195 34/39 70% 22 38% 64% $10.994 $7,035 $22.022 $14.987 25% $16,372 58 34 36 University of California, Irvine CA 19,179 24/55 57% 18 34% 72% $15,635 $8.507 $22.450 $13,944 81% $12,513 59 26 69 University of Missouri, Columbia MO 19.698 68 88% 18 32% 65% $13 208 8,138 $22.655 $14.517 87% $17,137 60 79 10 University of Minnesota, Morris MN 1,910 61 82% 14 50% 76% $13,477 $8,427 S13,477 $5,050 81% $9,208 61 64 48 University of Alabama AL 15,441 46 85% 18 31% 61% $11.197 $8,136 $18,357 $10.221 72% $18,978 62 71 76 University of South Carolina SC 16,567 29/36 70% 17 31% 58% $11.795 $8,794 $21.133 $12,339 91% $15,260 63 33 37 St. Mary's College of Maryland MD 1,823 67/60 59% 12 58% 67% $ 16,908 $12.908 S23,228 $10,320 61% $17,125 64 55 80 MI 5.915 68 92% 11 22% 63% $14,135 $9,339 S25,025 $15.686 81% $15,711 Michigan Technological University University of California, Santa Barbara 65 75 60 CA 17,714 38/55 51% 19 44% 73% $16,154 S10,231 S24,246 $14,015 87% NA 66 95 MN 32,457 64 74% 15 17% 53% $13.910 $7,902 S25,540 $17.638 79% NA 67 67 67 61 University of Minnesota Twin Cities Campus Mississippi University for Women California Polytechnic State University, San Luis Obispo MS 2.166 56 65% 13 21% 43% $8,649 58,649 $13,316 $4,667 80% $13.500 68 44 22 CA 17,401 39/64 39% 19 17% 66% $11,781 S10,429 $15,268 $4,839 76% $12.842 69 70 University of Wyoming WY 9.250 42 95% 15 22% 54% $10.863 $6,833 S16,713 $9.880 75% $18,311 70 84 88 George Mason University VA 16.687 26/29 66% 16 25% 48% $11,602 $7,597 21,442 $13.845 72% $14.143 71 59 93 University of Central Florida FL 32.044 30/36 62% 24 25% 49% $10,839 $8.353 $21,867 $13,514 77% $14.927 72 39 75 Ohio State University OH 36,855 69 74% 14 25% 59% $15,249 $11,315 S25,113 $13,798 75% $15,011 73 42 Illinois State University IL 18,353 47 81% 19 28% 55% $12.971 $7,199 $17,441 $10.242 80% $13.921 74 33 University at Buffalo The State University of New York NY 17,054 28/41 61% 14 32% 56% $13,422 S9,956 $19,372 $9.416 69% $16.255 75 53 55 Salisbury University MD 6,206 26/35 50% 17 50% 68% $12.895 $9.506 S19,783 $10,277 66% $14.773 76 77 University of Massachusetts Amherst MA 18,606 32/38 58% 19 41% 61% $14,480 $9,714 $23,333 $13.619 87% $15,321 77 62 84 University of Vermont VT 8,792 35/38 71% 14 48% 67% $17.116 $8,258 S30,168 $21.910 90% $22.425 78 78 71 College of Charleston SC 10.044 47/47 60% 14 32% 52% $14,008 $11,214 $21,270 $10,056 67% $15,135 79 96 Indiana University Bloomington IN 30,752 27/33 81% 20 40% 65% $13,129 $8,704 S24,164 $15,460 64% $16,930 80 18 82 PA 34,829 40/60 57% 17 43% 80% $17,017 $12.872 S26,639 $13.767 75% $17.900 Pennsylvania State University University Park Campus State University of New York at Albany 81 65 49 NY 11,953 26/35 56% 21 52% 66% $13,574 $9,599 $19,524 $9.925 71% $15, 108 82 85 University of Arizona AZ 28 278 27/33 86% 19 29% 55% $11, 163 $8,506 $19,933 $11,427 NA $17,340 I 83 89 78 Towson University MD 14.296 18/26 58% 19 30% 56% $12.776 58,651 $20,422 $11.771 81% $15,530 84 56 NJ 3,800 19/24 54% 11 21% 60% $16.189 S10.111 $22.703 $12.592 91% $15.223 Rutgers. The State University of New Jersey, Camden University of Maryland, Baltimore County 85 88 74 MD 9,549 46/63 63% 17 28% 53% $16.516 $12.946 $23,368 $10.422 61% $14.500 86 72 89 University of Connecticut СТ 14,716 33/42 62% 17 23% 70% $14,413 $9,141 $25,197 $16.056 79% $16,093 87 46 81 University of Pittsburgh PA 17.910 48/56 55% 17 35% 60% $17,025 $12.723 S26,337 $13.614 86% $20,154 88 64 NY 4.900 22/25 53% 18 47% 66% $11,782 S8,961 $17,732 $8.771 77% $12.430 89 60 57 State University of New York College at Fredonia Stony Brook University, State University of New York State University of New York at New Paltz NY 14,224 25/50 54% 54% 18 30% 51% $13,645 S9,704 $19,595 $9,891 72% $15,747 90 74 65 NY 6.187 30/29 40% 17 21% 52% $11,276 8,276 S16,176 $7.900 75% $15,000 91 90 University of Maine ME 8,817 22/29 79% 15 29% 56% $12.780 $8,162 S21,480 $13,318 79% $17.917 92 91 University of New Hampshire NH 11,496 25/32 77% 14 48% 71% $15,779 $13,693 S26,139 $12.446 80% $20,700 93 45 92 University of Missouri, Rolla MO 3,849 83 92% 14 10% 52% $14,326 S9,416 S23,144 $13,728 87% $17.991 94 98 79 University of California, Santa Cruz CA 12.881 37/39 80% 19 40% 64% $16,877 $9,309 S24,250 $14.941 90% $13,282 95 94 66 Rowan University NJ 8.324 22/33 44% 14 37% 63% $15,416 $10.632 $20,812 $10,180 91% NA 96 99 University of Illinois at Chicago IL 16,543 43 63% 15 9% 37% $14,299 S6,399 $23.995 $17.596 86% $17,000 97 100 University of Oregon OR 16.041 30/31 86% 18 36% 59% $12.795 $9.586 S24.231 $14,645 77% $22.783 98 86 Texas Tech University TX 22.768 23/29 69% 20 22% 51% $12.968 $9,878 $20,048 $10,170 52% $13,805 99 96 98 Ohio University OH 17,343 49 75% 20 43% 70% $16,514 $13,102 S24,737 $11.635 68% $15,285 100 94 UC Riverside CA 14,124 16/34 86% 19 39% 64% $16.751 $9.932 S24,530 $17,711 82% $13.226SECTION IPerform an appropriate hypothesis test for these three questions using =.10. Show all important values you use as part of your test, including the null hypothesis, alternate hypothesis, test statistic value, and either the rejection region and critical value or p-value depending on the method you choose to use. State the result of your test in a complete sentence in context of the question. SECTION IICreate 90% confidence intervals for the average 4-year graduation rate for the VA schools in the top 100 public Universities in 2003 and the NC schools in the top 100. Using these confidence intervals, what would you conclude about your three research questions? Why? SECTION IIIDid you find a different results using the confidence intervals than when you used hypothesis tests? If so, why do you think the results were different? If not, which method is better to answering your question? Does one method give you better information than the other?
Step by Step Solution
There are 3 Steps involved in it
Step: 1
To perform an appropriate hypothesis test and create confidence intervals for the given questions we would need the following information for the Virginia VA and North Carolina NC colleges from the da...Get Instant Access to Expert-Tailored Solutions
See step-by-step solutions with expert insights and AI powered tools for academic success
Step: 2
Step: 3
Ace Your Homework with AI
Get the answers you need in no time with our AI-driven, step-by-step assistance
Get Started