Answered step by step
Verified Expert Solution
Question
1 Approved Answer
Learning Objectives 1 . Create a pivot table in Excel 2 . Add new calculated field to pivot table 3 . Create a pivot chart
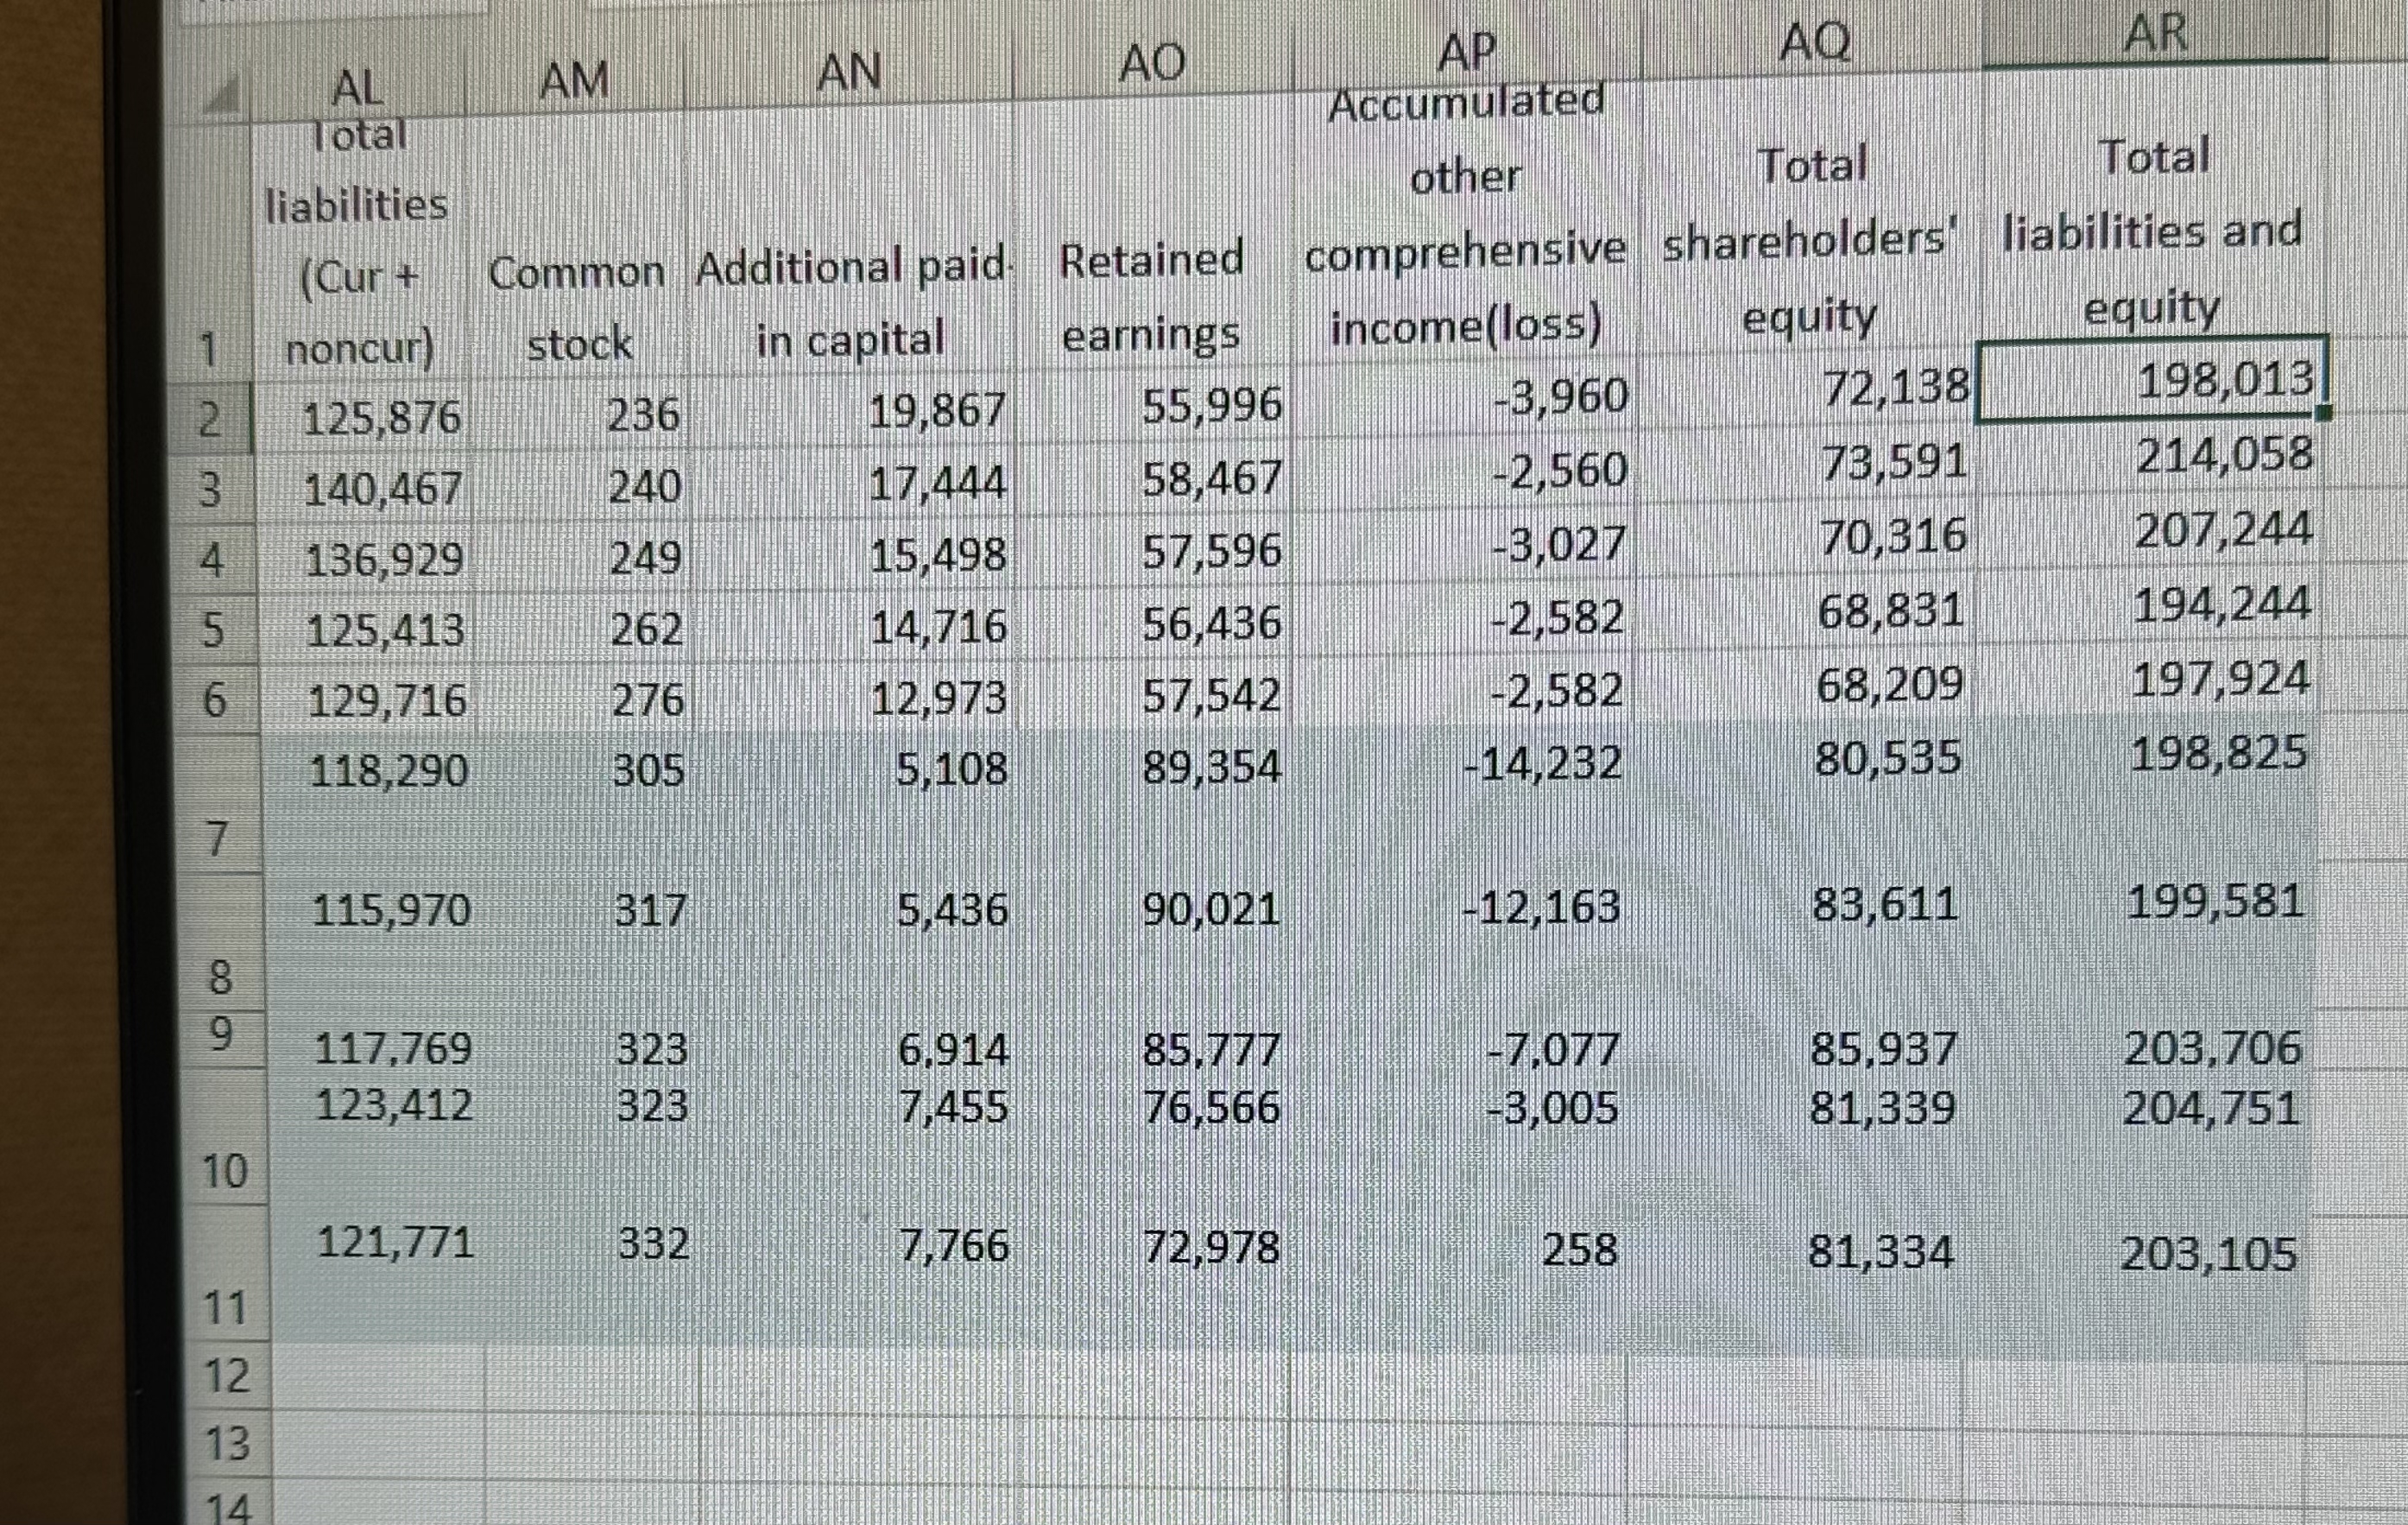
Learning Objectives Create a pivot table in Excel Add new calculated field to pivot table Create a pivot chart with appropriate labels Apply appropriate numeric format on pivot table and chart Analyze and interpret outcome of pivot tables and calculated fields Data Set Background As an analyst you are asked to conduct research into the relative merits of investing of two companies operating in the discount retail industry. Circuit Discount TV and General Brands, Inc. invest in equity securities on a longterm basis. To do so you should evaluate the percentage of noncurrent assets invested in equity securities The investment in equity to noncurrent assets formula is: Total Equity InvestmentsTotal Noncurrent Assets. The data set contains the elements of the balance sheet of both companies for the five years through Requirements: Create a pivot table to summarize the investment in equity securities and total noncurrent assets of the for the fiveyear period through on a separate worksheet. The data should be summarized by each company for all relevant years. Label the worksheet InvToNCAssets. On the pivot table add a calculated field to calculate the investment equity to noncurrent assets percentage carry out decimal places for each company for the fiveyear period through Label calculated field Investment to Noncrt Asset. On the InvToNCAssets worksheet, create a pivot clustered column chart to summarize the investment equity to noncurrent assets percentage from pivot table for each company and all years, through Each companys data for each year should be displayed side by side and labels on outside end of each bar to display percentage. The Y axis should display percentage intervals carried to two decimal places. The X axis should display the companyyear Change the title of the of the pivot chart to Investments in Equity to Noncurrent Assets Bar Chart. Based on your output, answer the following questions on a separate worksheet labeled Responses: a What is the percentage of noncurrent assets invested in equity securities for each company, Circuit Discount TV and General Brands Inc.? AC Intermediate Accounting III, Spring b When comparing the percentage of noncurrent assets invested in equity securities ratios over the most recent fiveyear period, is Circuit Discount TV equity investment generally increasing or decreasing from year to year, or remained roughly the same? c In general, which company invests the higher amount in equity securities as a percentage of its noncurrent assets during the most recent fiveyear period? The worksheets should be formatted with appropriate numeric values using accounting format with zero decimals unless indicated otherwise.
Step by Step Solution
There are 3 Steps involved in it
Step: 1

Get Instant Access to Expert-Tailored Solutions
See step-by-step solutions with expert insights and AI powered tools for academic success
Step: 2

Step: 3
Ace Your Homework with AI
Get the answers you need in no time with our AI-driven, step-by-step assistance
Get Started