Answered step by step
Verified Expert Solution
Question
1 Approved Answer
Python modules. Random numbers: module random functions uniform and normalvariate. Plotting: module matplotlib. Simple deterministic, discrete-time SIR model of an epidemic. Refresher problems. Before


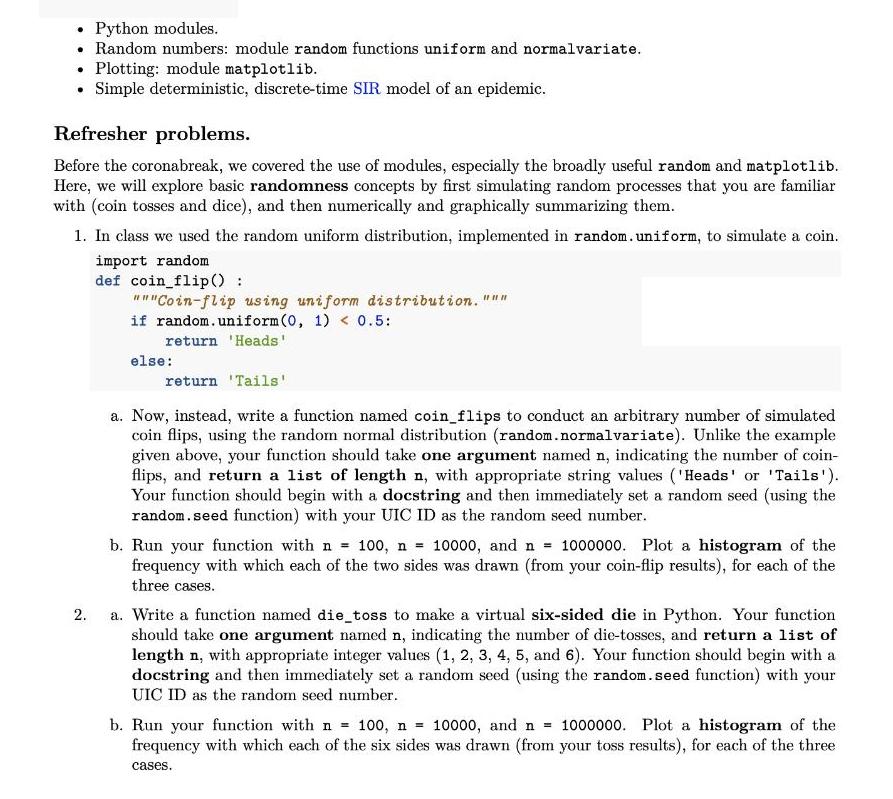
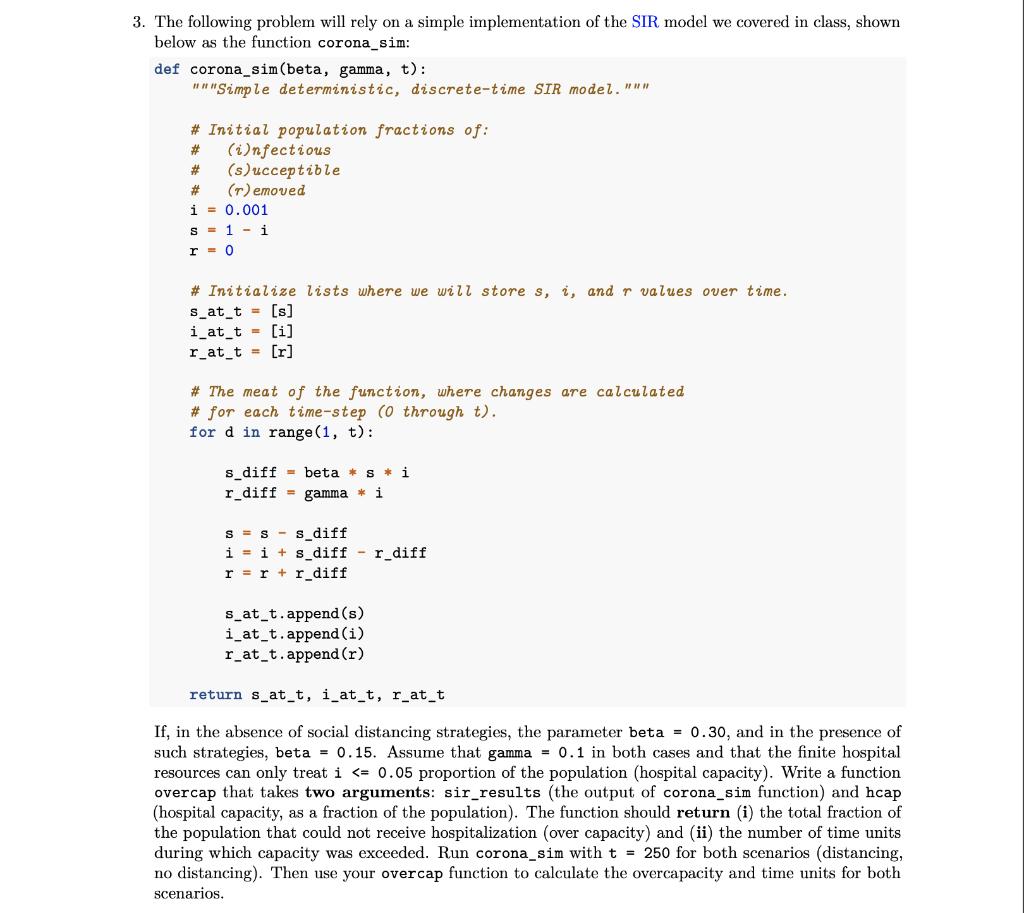
Python modules. Random numbers: module random functions uniform and normalvariate. Plotting: module matplotlib. Simple deterministic, discrete-time SIR model of an epidemic. Refresher problems. Before the coronabreak, we covered the use of modules, especially the broadly useful random and matplotlib. Here, we will explore basic randomness concepts by first simulating random processes that you are familiar with (coin tosses and dice), and then numerically and graphically summarizing them. 1. In class we used the random uniform distribution, implemented in random.uniform, to simulate a coin. import random def coin_flip(): """Coin-flip using uniform distribution. """ if random.uniform(0, 1) < 0.5: return 'Heads' else: return 'Tails' a. Now, instead, write a function named coin_flips to conduct an arbitrary number of simulated coin flips, using the random normal distribution (random.normalvariate). Unlike the example given above, your function should take one argument named n, indicating the number of coin- flips, and return a list of length n, with appropriate string values ('Heads' or 'Tails'). Your function should begin with a docstring and then immediately set a random seed (using the random.seed function) with your UIC ID as the random seed number. b. Run your function with n 100, n 10000, and n 1000000. Plot a histogram of the frequency with which each of the two sides was drawn (from your coin-flip results), for each of the three cases. 2. a. Write a function named die toss to make a virtual six-sided die in Python. Your function should take one argument named n, indicating the number of die-tosses, and return a list of length n, with appropriate integer values (1, 2, 3, 4, 5, and 6). Your function should begin with a docstring and then immediately set a random seed (using the random.seed function) with your UIC ID as the random seed number. b. Run your function with n = 100, n 1000o, and n = 1000000. Plot a histogram of the frequency with which each of the six sides was drawn (from your toss results), for each of the three cases. 3. The following problem will rely on a simple implementation of the SIR model we covered in class, shown below as the function corona_sim: def corona_sim (beta, gamma, t): nn"Simple deterministic, discrete-time SIR model."u # Initial population fractions of: (i)nfectious (s)ucceptible (r) emoved i = 0.001 #3 #3 %23 S = 1 - i r = 0 # Initialize lists where we will store s, i, and r values over time. s_at_t = [s] i_at_t = [i] r_at_t = [r] # The meat of the function, where changes are calculated # for each time-step (0 through t). for d in range (1, t): s diff = beta * s * i r_diff = gamma * i S = s - s diff i - i + s_diff r_diff r = r +r_diff s_at t.append (s) i_at_t.append (i) r_at_t.append (r) return s_at_t, i_at_t, r_at_t If, in the absence of social distancing strategies, the parameter beta = 0.30, and in the presence of such strategies, beta = 0.15. Assume that gamma = 0.1 in both cases and that the finite hospital resources can only treat i
Step by Step Solution
★★★★★
3.55 Rating (165 Votes )
There are 3 Steps involved in it
Step: 1
1 Code Screenshots Sample Output Files case1png case2png case3png Code to Copy Import the random module import random Import the matplotlib for plotting the histogram for the three cases import matplo...
Get Instant Access to Expert-Tailored Solutions
See step-by-step solutions with expert insights and AI powered tools for academic success
Step: 2

Step: 3

Ace Your Homework with AI
Get the answers you need in no time with our AI-driven, step-by-step assistance
Get Started


