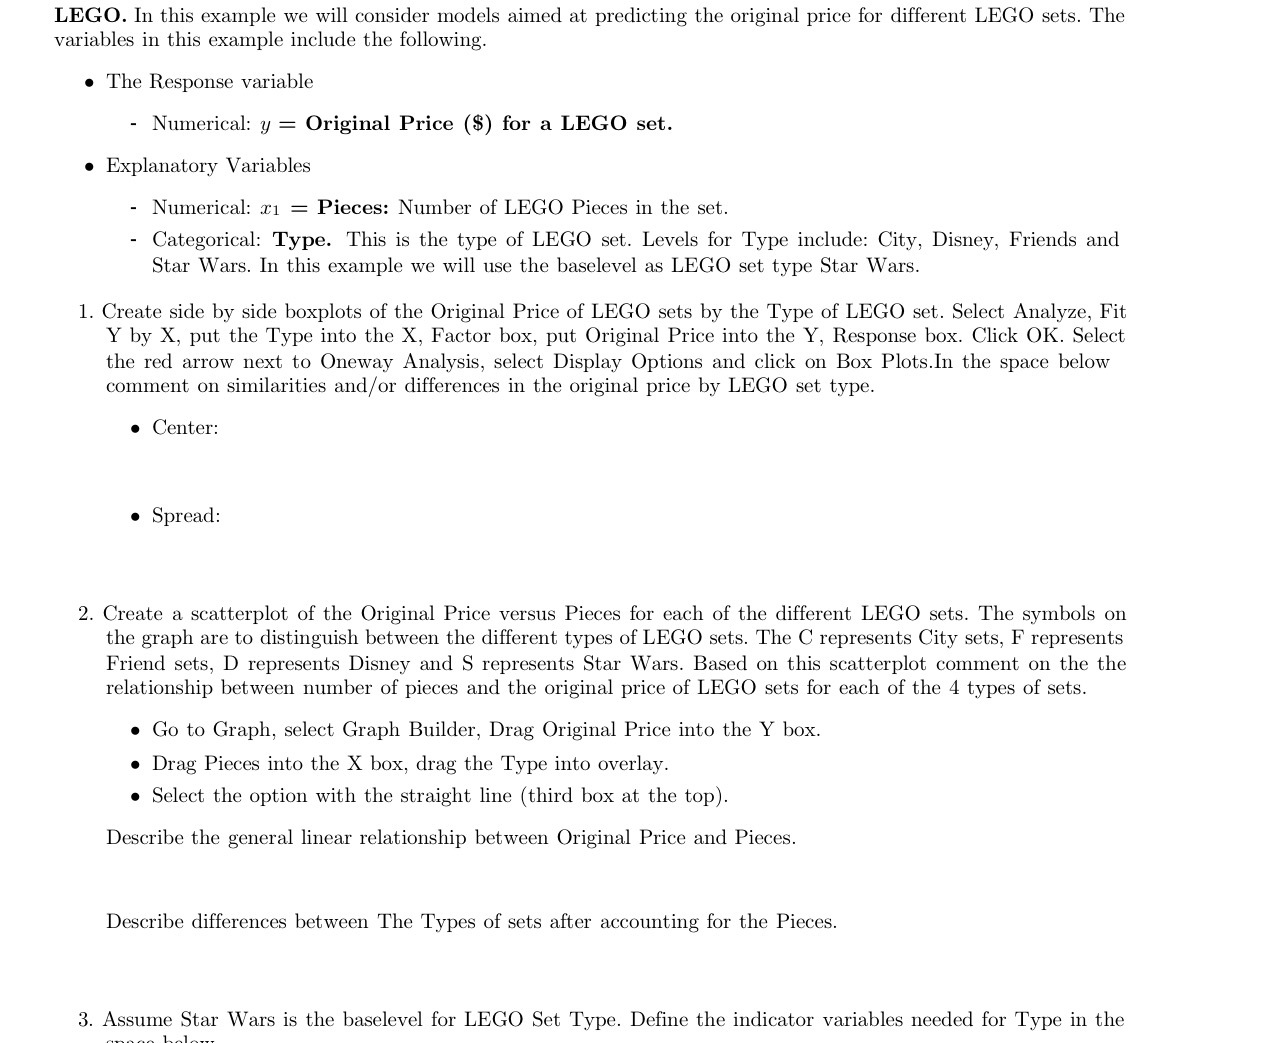
LEGO. In this example we will consider models aimed at predicting the original price for different LEGO sets. The variables in this example include the following. o The Response variable - Numerical: y 2 Original Price ($) for a LEGO set. 0 Explanatory Variables - Numerical: x1 = Pieces: Number of LEGO Pieces in the set. - Categorical: Type. This is the type of LEGO set. Levels for Type include: City, Disney, Friends and Star Wars. In this example we will use the baselevel as LEGO set type Star Wars. 1. Create side by side boxplots of the Original Price of LEGO sets by the Type of LEGO set. Select Analyze, Fit Y by X, put the Type into the X, Factor box, put Original Price into the Y, Response box. Click OK. Select the red arrow next to Oneway Analysis, select Display Options and click on Box Plots.In the Space below comment on similarities andfor differences in the original price by LEGO set type. 0 Center: 9 Spread: 2. Create a scatterplot of the Original Price versus Pieces for each of the different LEGO sets. The symbols on the graph are to distinguish between the different types of LEGO sets. The C represents City sets, F represents Friend sets, D represents Disney and S represents Star Wars. Based on this scatterplot comment on the the relationship between number of pieces and the original price of LEGO sets for each of the 4 types of sets. 0 Go to Graph, select Graph Builder, Drag Original Price into the Y box. 0 Drag Pieces into the X box, drag the Type into overlay. 0 Select the option with the straight line (third box at the top). Describe the general linear relationship between Original Price and Pieces. Describe differences between The Types of sets after accounting for the Pieces. 3. Assume Star Wars is the baselevel for LEGO Set Type. Define the indicator variables needed for Type in the n._.\\ A\" L...l