Answered step by step
Verified Expert Solution
Question
1 Approved Answer
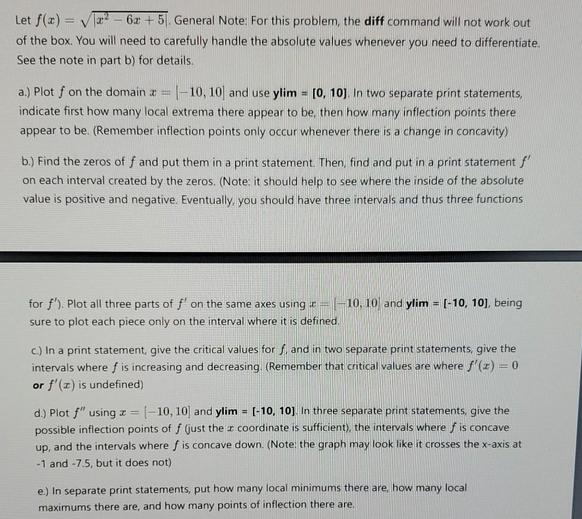
Let f(x)=x - 6x + 5. General Note: For this problem, the diff command will not work out of the box. You will need

Let f(x)=x - 6x + 5. General Note: For this problem, the diff command will not work out of the box. You will need to carefully handle the absolute values whenever you need to differentiate. See the note in part b) for details. a.) Plot f on the domain a == -10, 10] and use ylim = [0, 10]. In two separate print statements, indicate first how many local extrema there appear to be, then how many inflection points there appear to be. (Remember inflection points only occur whenever there is a change in concavity) b.) Find the zeros of f and put them in a print statement. Then, find and put in a print statement f' on each interval created by the zeros. (Note: it should help to see where the inside of the absolute value is positive and negative. Eventually, you should have three intervals and thus three functions for f'). Plot all three parts of f' on the same axes usingiz=-10, 10 and ylim E [-10, 10], being sure to plot each piece only on the interval where it is defined. c.) In a print statement, give the critical values for f, and in two separate print statements, give the intervals where f is increasing and decreasing. (Remember that critical values are where f'(x) = 0 or f'(z) is undefined) d.) Plot f" using z = -10, 10] and ylim = [-10, 10]. In three separate print statements, give the possible inflection points of f (just the coordinate is sufficient), the intervals where f is concave up, and the intervals where f is concave down. (Note: the graph may look like it crosses the x-axis at -1 and -7.5, but it does not). e) In separate print statements, put how many local minimums there are, how many local maximums there are, and how many points of inflection there are. Let f(x)= - 6x +5. General Note: For this problem, the diff command will not work out of the box. You will need to carefully handle the absolute values whenever you need to differentiate. See the note in part b) for details. a.) Plot f on the domain a == -10, 10] and use ylim= [0, 10]. In two separate print statements, indicate first how many local extrema there appear to be, then how many inflection points there appear to be. (Remember inflection points only occur whenever there is a change in concavity) b.) Find the zeros of f and put them in a print statement. Then, find and put in a print statement f' on each interval created by the zeros. (Note: it should help to see where the inside of the absolute value is positive and negative. Eventually, you should have three intervals and thus three functions for f'). Plot all three parts of f' on the same axes using z=-10, 10 and ylim E [-10, 10], being sure to plot each piece only on the interval where it is defined. c.) In a print statement, give the critical values for f, and in two separate print statements, give the intervals where f is increasing and decreasing. (Remember that critical values are where f'(x) = 0 or f'(z) is undefined) d.) Plot f" using z = -10, 10] and ylim = [-10, 10]. In three separate print statements, give the possible inflection points of f (just the coordinate is sufficient), the intervals where f is concave up, and the intervals where f is concave down. (Note: the graph may look like it crosses the x-axis at -1 and -7.5, but it does not). e) In separate print statements, put how many local minimums there are, how many local maximums there are, and how many points of inflection there are.
Step by Step Solution
★★★★★
3.38 Rating (164 Votes )
There are 3 Steps involved in it
Step: 1
a To plot fx sqrtx2 6x 5 we first need to identify local extrema and inflection points visua...
Get Instant Access to Expert-Tailored Solutions
See step-by-step solutions with expert insights and AI powered tools for academic success
Step: 2

Step: 3

Ace Your Homework with AI
Get the answers you need in no time with our AI-driven, step-by-step assistance
Get Started


