Answered step by step
Verified Expert Solution
Link Copied!

Question

1 Approved Answer

Let K and K be two strike prices, and Ky K2 - K1 ii. Pe(K2) - PE(K1) > K2 - K1 iii. The graph showing
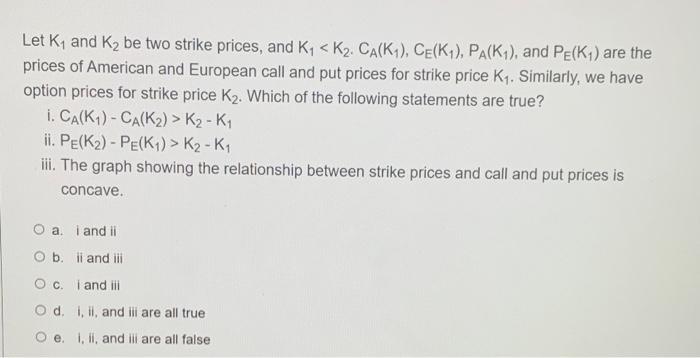
image text in transcribed
Let K and K be two strike prices, and Ky K2 - K1 ii. Pe(K2) - PE(K1) > K2 - K1 iii. The graph showing the relationship between strike prices and call and put prices is concave. O a. i and it O b. li and ili Oci and it Od 1. ll, and iii are all true Oe. I, ll, and ill are all false

Step by Step Solution

There are 3 Steps involved in it

Step: 1

blur-text-image

Get Instant Access to Expert-Tailored Solutions

See step-by-step solutions with expert insights and AI powered tools for academic success

Step: 2

blur-text-image_2

Step: 3

blur-text-image_3

Ace Your Homework with AI

Get the answers you need in no time with our AI-driven, step-by-step assistance

Get Started

Recommended Textbook for

Asset Management And Institutional Investors

Authors: Ignazio Basile, Pierpaolo Ferrari

1st Edition

331932795X,3319327968

More Books

Students also viewed these Finance questions

Question

6. What are process costs?

Answered: 1 week ago