Answered step by step
Verified Expert Solution
Question
1 Approved Answer
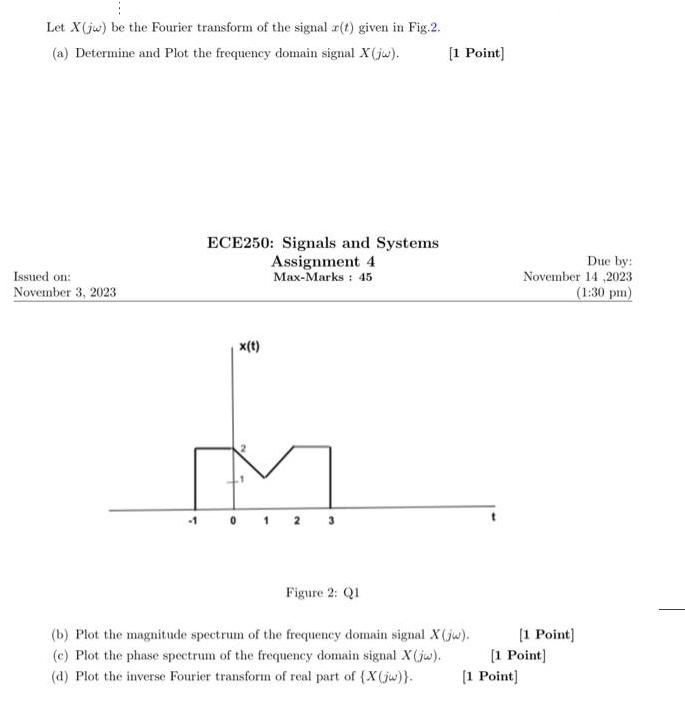
Let X(jw) be the Fourier transform of the signal r(t) given in Fig.2. (a) Determine and Plot the frequency domain signal X(jw). Issued on:

Let X(jw) be the Fourier transform of the signal r(t) given in Fig.2. (a) Determine and Plot the frequency domain signal X(jw). Issued on: November 3, 2023 -1 ECE250: Signals and Systems Assignment 4 Max-Marks 45 x(t) Figure 2: Q1 [1 Point] (b) Plot the magnitude spectrum of the frequency domain signal X(jw). (c) Plot the phase spectrum of the frequency domain signal X(jw). (d) Plot the inverse Fourier transform of real part of (X(jw)}. Due by: November 14,2023 (1:30 pm) [1 Point] [1 Point] [1 Point] Let X(jw) be the Fourier transform of the signal r(t) given in Fig.2. (a) Determine and Plot the frequency domain signal X(jw). Issued on: November 3, 2023 -1 ECE250: Signals and Systems Assignment 4 Max-Marks 45 x(t) Figure 2: Q1 [1 Point] (b) Plot the magnitude spectrum of the frequency domain signal X(jw). (c) Plot the phase spectrum of the frequency domain signal X(jw). (d) Plot the inverse Fourier transform of real part of (X(jw)}. Due by: November 14,2023 (1:30 pm) [1 Point] [1 Point] [1 Point]
Step by Step Solution
★★★★★
3.48 Rating (158 Votes )
There are 3 Steps involved in it
Step: 1

Get Instant Access to Expert-Tailored Solutions
See step-by-step solutions with expert insights and AI powered tools for academic success
Step: 2

Step: 3

Ace Your Homework with AI
Get the answers you need in no time with our AI-driven, step-by-step assistance
Get Started


