Answered step by step
Verified Expert Solution
Link Copied!

Question

1 Approved Answer

Let y=f(x)y=f(x) be given by the graph below. a) Sketch the graph of y=f(3x)-2y=f(3x)2. Label at least 3 points on the graph. State the new

Let y=f(x)y=f(x) be given by the graph below. 
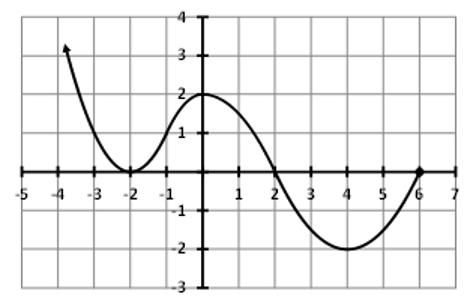
a) Sketch the graph of y=f(3x)-2y=f(3x)−2. Label at least 3 points on the graph. 

State the new domain and range of y=f(3x)-2y=f(3x)−2. 

b) On a separate graph, sketch the graph of y=-f(x-1)y=−f(x−1). Label at least 3 points on the graph. 

State the new domain and range of y=-f(x-1)y=−f(x−1).

4 -3 -2 -1 1 3 4 $ -1 -2 -3

Step by Step Solution

There are 3 Steps involved in it

Step: 1

blur-text-image

Get Instant Access to Expert-Tailored Solutions

See step-by-step solutions with expert insights and AI powered tools for academic success

Step: 2

blur-text-image

Step: 3

blur-text-image

Ace Your Homework with AI

Get the answers you need in no time with our AI-driven, step-by-step assistance

Get Started

Recommended Textbook for

Mathematical Statistics With Applications In R

Authors: Chris P. Tsokos, K.M. Ramachandran

2nd Edition

124171133, 978-0124171138

More Books

Students also viewed these Mathematics questions

Question

Find the h parameters for the networks in Fig. 19.88. 40 10 60 20

Answered: 1 week ago