Answered step by step
Verified Expert Solution
Question
1 Approved Answer
Let's consider a hypothetical equity index. For simplicity, assume that the index price level, denoted as St, can only take positive integer values. That

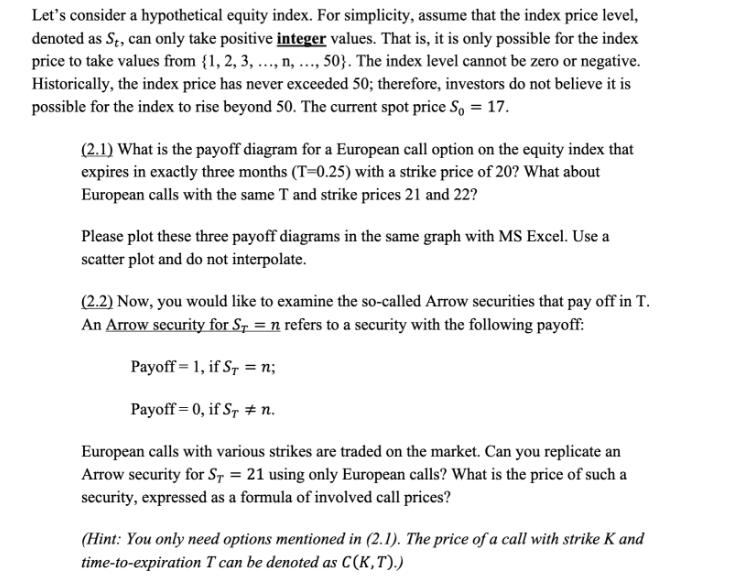
Let's consider a hypothetical equity index. For simplicity, assume that the index price level, denoted as St, can only take positive integer values. That is, it is only possible for the index price to take values from {1, 2, 3, ..., n, ..., 50}. The index level cannot be zero or negative. Historically, the index price has never exceeded 50; therefore, investors do not believe it is possible for the index to rise beyond 50. The current spot price So = 17. (2.1) What is the payoff diagram for a European call option on the equity index that expires in exactly three months (T-0.25) with a strike price of 20? What about European calls with the same T and strike prices 21 and 22? Please plot these three payoff diagrams in the same graph with MS Excel. Use a scatter plot and do not interpolate. (2.2) Now, you would like to examine the so-called Arrow securities that pay off in T. An Arrow security for ST = n refers to a security with the following payoff: Payoff = 1, if Sr = n; Payoff = 0, if ST # n. European calls with various strikes are traded on the market. Can you replicate an Arrow security for ST = 21 using only European calls? What is the price of such a security, expressed as a formula of involved call prices? (Hint: You only need options mentioned in (2.1). The price of a call with strike K and time-to-expiration T can be denoted as C(K,T).)
Step by Step Solution
★★★★★
3.31 Rating (142 Votes )
There are 3 Steps involved in it
Step: 1
Here are the answers to the questions 21 The payoff diagrams for the Europe...
Get Instant Access to Expert-Tailored Solutions
See step-by-step solutions with expert insights and AI powered tools for academic success
Step: 2

Step: 3

Ace Your Homework with AI
Get the answers you need in no time with our AI-driven, step-by-step assistance
Get Started


