

Question
Let's look at this Fall 2018 & Fall 2019 GPA dashboard. It was created by the research office at LAVC.Navigate to page 1, Overview of
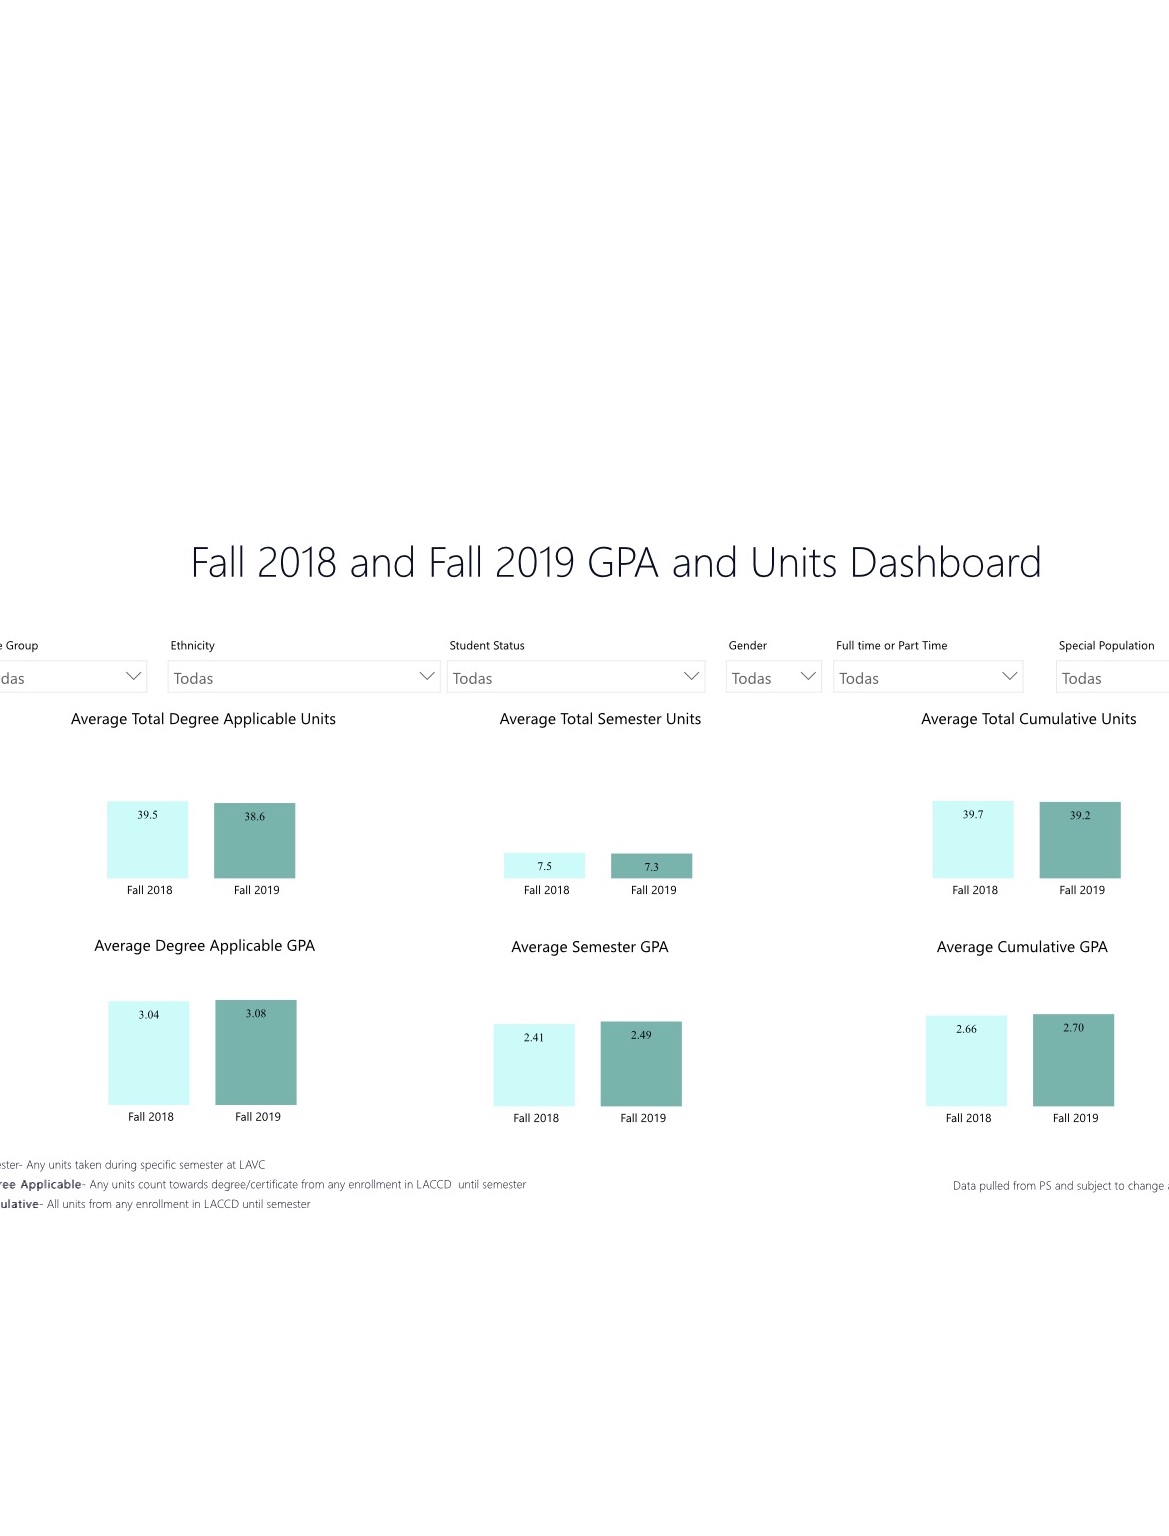
Let's look at this Fall 2018 & Fall 2019 GPA dashboard. It was created by the research office at LAVC.Navigate to page 1, "Overview" of the dashboard-- this dashboard shows the average GPA for Fall 2018 students and Fall 2019 students. You can also navigate to page 4, "Semester GPA by Demographics" as you write up #2 below.The filters at the top of the page allow you to look at the average GPA for different groups (ethnicity, age, gender, etc).For purposes of our exercise, we will focus on the middle section, "Average Semester GPA"- which is one of the dependent variables for the data project! You can also look at the top middle section, "Average Total Semester Units".Choose at least one filter and state what you observe in a sentence. (Sample sentence: The Asian students had an GPA of 2.83 during Fall 2019). Write a sentence comparing two groups. (Sample: In Fall 2018, female students have an average cumulative GPA of 2.48, while the male students had an average GPA of 2.32.)Provide your reaction to the data you wrote about in the previous points. Was it surprising? Expected? What do you think may contribute to the data? (Sample: In Fall 2018, females had a slightly higher GPA than males. In general, research has shown that females do better in school than males due to their ability to focus, persist and pay attention to deadlines. Females having higher GPA didn't surprise me.)Reply to two other students' sentences, checking to see if their statements are correct. If it's incorrect, correct the statements. If it's correct, write a thoughtful comment (do not just say it's correct). (Sample correct statement: It's interesting that older students have a higher GPA than younger students, what are some causes of this?)https://docs.google.com/document/d/1-aNAdYoFzjv_Bh30ugLamCQBvceR8WCVuROaBgDxB0k/edit
Step by Step Solution
There are 3 Steps involved in it
Step: 1

Get Instant Access to Expert-Tailored Solutions
See step-by-step solutions with expert insights and AI powered tools for academic success
Step: 2

Step: 3
Ace Your Homework with AI
Get the answers you need in no time with our AI-driven, step-by-step assistance
Get Started
A First Course In Differential Equations
Authors: Kumari Vandana
1st Edition
9353147123, 9789353147129