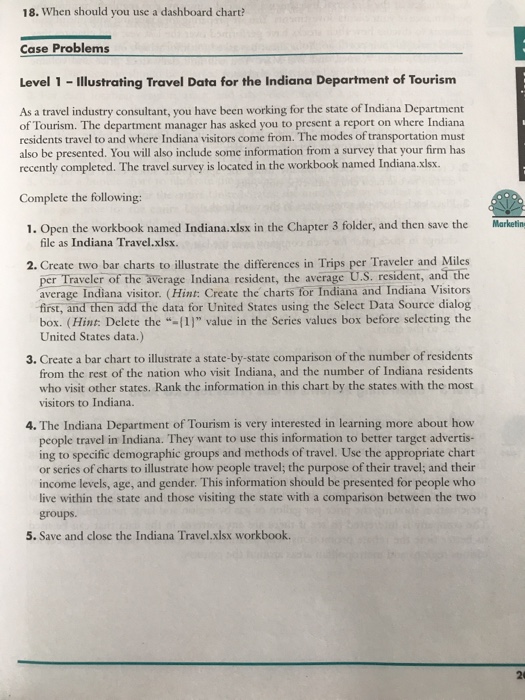
Level 1 - Illustrating Travel Data for the Indiana Department of Tourism As a travel industry consultant, you have been working for the state of Indiana Department of Tourism. The department manager has asked you to present a report on where Indiana residents travel to and where Indiana visitors come from. The modes of transportation must also be presented. You will also include some information from a survey that your firm has recently completed. The travel survey is located in the workbook named Indiana.xlsx. Complete the following: 1. Open the workbook named Indiana.xlsx in the Chapter 3 folder, and then save the file as Indiana Travel.xlsx. 2. Create two bar charts to illustrate the differences in Trips per Traveler and Miles per Traveler of the average Indiana resident, the average U.S. resident, and the average Indiana visitor. 3. Create a bar chart to illustrate a state-by-state comparison of the number of residents from the rest of the nation who visit Indiana, and the number of Indiana residents who visit other states. Rank the information in this chart by the states with the most visitors to Indiana. 4. The Indiana Department of Tourism is very interested in learning more about how people travel in Indiana. They want to use this information to better target advertising to specific demographic groups and methods of travel. Use the appropriate chart or series of charts to illustrate how people travel: the purpose of their travel: and their income levels, age, and gender. This information should be presented for people who live within the state and those visiting the state with a comparison between the two groups. 5. Save and close the Indiana Travel.xlsx workbook. Level 1 - Illustrating Travel Data for the Indiana Department of Tourism As a travel industry consultant, you have been working for the state of Indiana Department of Tourism. The department manager has asked you to present a report on where Indiana residents travel to and where Indiana visitors come from. The modes of transportation must also be presented. You will also include some information from a survey that your firm has recently completed. The travel survey is located in the workbook named Indiana.xlsx. Complete the following: 1. Open the workbook named Indiana.xlsx in the Chapter 3 folder, and then save the file as Indiana Travel.xlsx. 2. Create two bar charts to illustrate the differences in Trips per Traveler and Miles per Traveler of the average Indiana resident, the average U.S. resident, and the average Indiana visitor. 3. Create a bar chart to illustrate a state-by-state comparison of the number of residents from the rest of the nation who visit Indiana, and the number of Indiana residents who visit other states. Rank the information in this chart by the states with the most visitors to Indiana. 4. The Indiana Department of Tourism is very interested in learning more about how people travel in Indiana. They want to use this information to better target advertising to specific demographic groups and methods of travel. Use the appropriate chart or series of charts to illustrate how people travel: the purpose of their travel: and their income levels, age, and gender. This information should be presented for people who live within the state and those visiting the state with a comparison between the two groups. 5. Save and close the Indiana Travel.xlsx workbook


