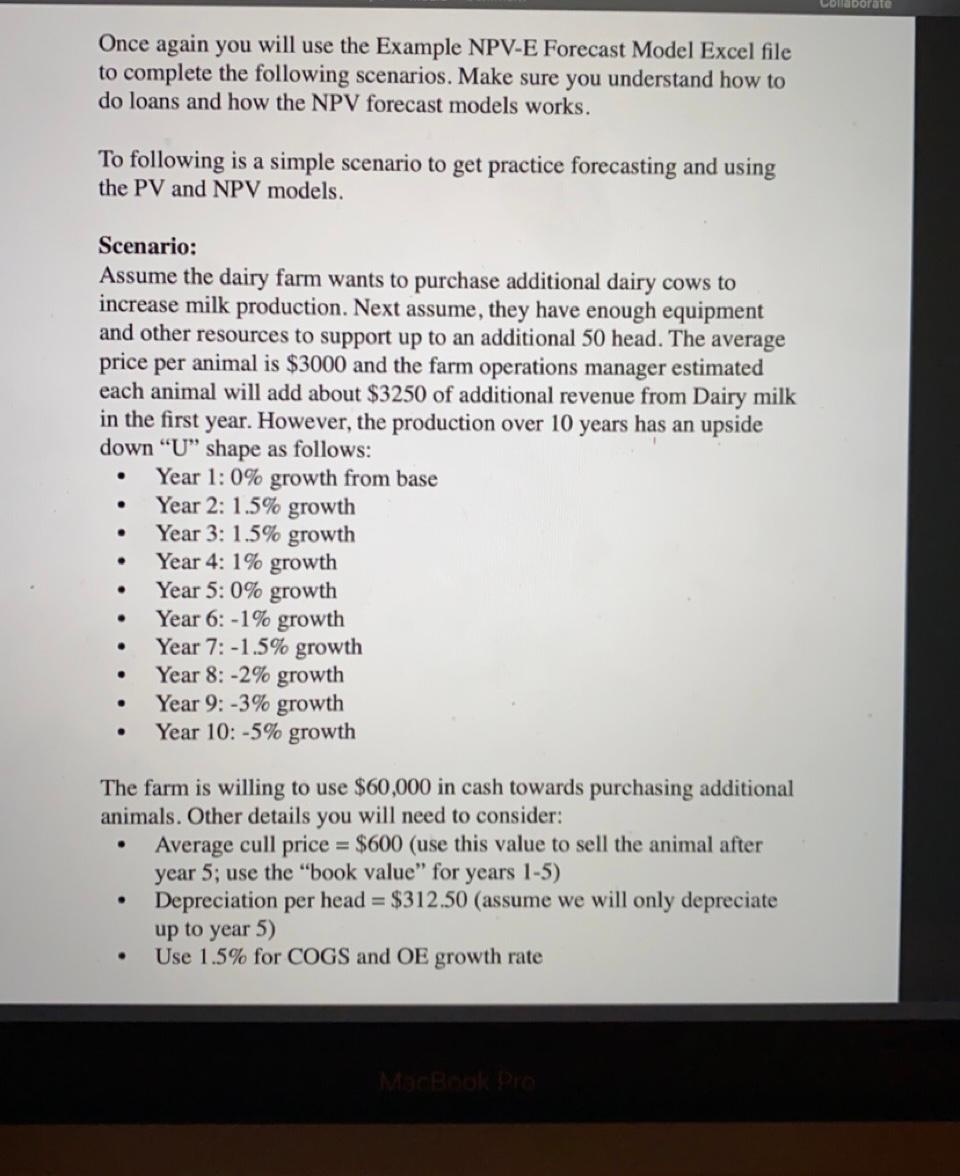
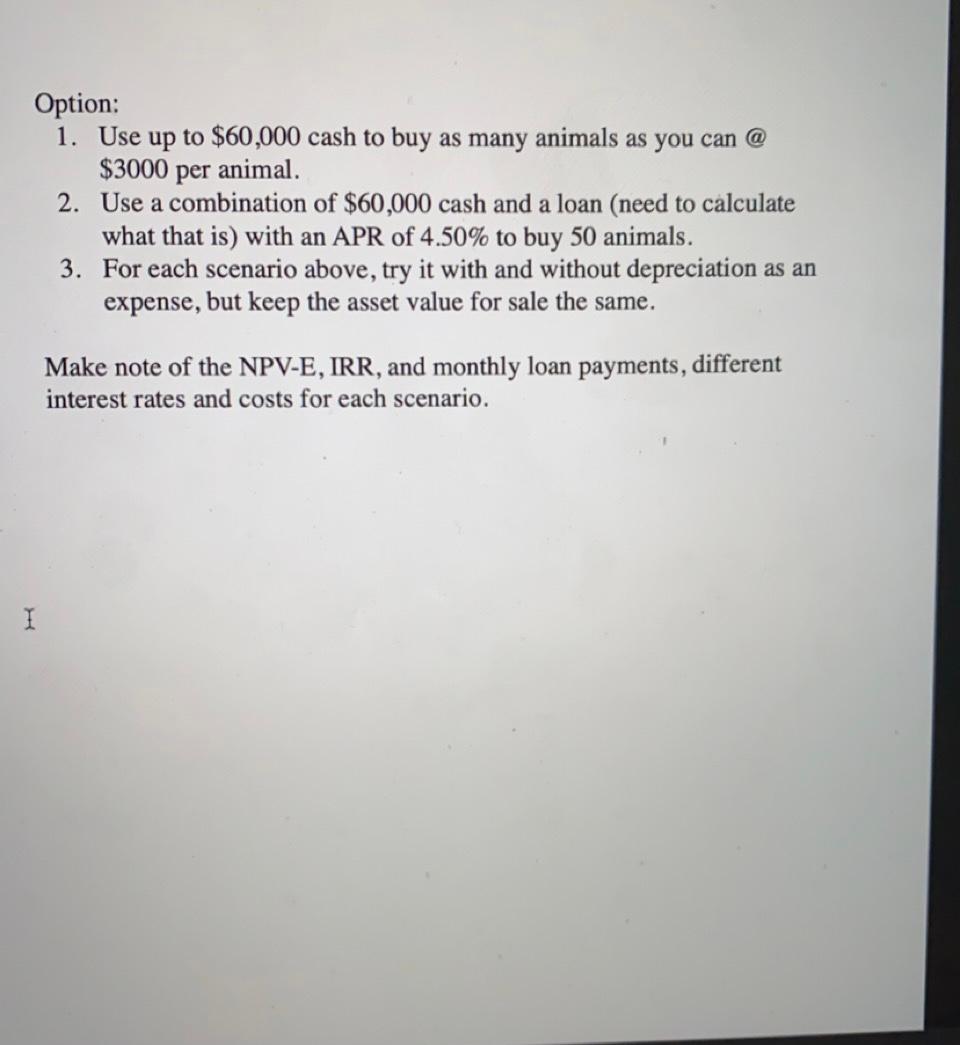
LHDOTT Once again you will use the Example NPV-E Forecast Model Excel file to complete the following scenarios. Make sure you understand how to do loans and how the NPV forecast models works. To following is a simple scenario to get practice forecasting and using the PV and NPV models. Scenario: Assume the dairy farm wants to purchase additional dairy cows to increase milk production. Next assume, they have enough equipment and other resources to support up to an additional 50 head. The average price per animal is $3000 and the farm operations manager estimated each animal will add about $3250 of additional revenue from Dairy milk in the first year. However, the production over 10 years has an upside down "U" shape as follows: Year 1: 0% growth from base Year 2: 1.5% growth Year 3: 1.5% growth Year 4: 1% growth Year 5: 0% growth Year 6: -1% growth Year 7: -1.5% growth Year 8: -2% growth Year 9: -3% growth Year 10: -5% growth The farm is willing to use $60,000 in cash towards purchasing additional animals. Other details you will need to consider: Average cull price = $600 (use this value to sell the animal after year 5; use the "book value" for years 1-5) Depreciation per head = $312.50 (assume we will only depreciate up to year 5) Use 1.5% for COGS and OE growth rate Manok Pro Option: 1. Use up to $60,000 cash to buy as many animals as you can @ $3000 per animal. 2. Use a combination of $60,000 cash and a loan (need to calculate what that is) with an APR of 4.50% to buy 50 animals. 3. For each scenario above, try it with and without depreciation as an expense, but keep the asset value for sale the same. Make note of the NPV-E, IRR, and monthly loan payments, different interest rates and costs for each scenario. I LHDOTT Once again you will use the Example NPV-E Forecast Model Excel file to complete the following scenarios. Make sure you understand how to do loans and how the NPV forecast models works. To following is a simple scenario to get practice forecasting and using the PV and NPV models. Scenario: Assume the dairy farm wants to purchase additional dairy cows to increase milk production. Next assume, they have enough equipment and other resources to support up to an additional 50 head. The average price per animal is $3000 and the farm operations manager estimated each animal will add about $3250 of additional revenue from Dairy milk in the first year. However, the production over 10 years has an upside down "U" shape as follows: Year 1: 0% growth from base Year 2: 1.5% growth Year 3: 1.5% growth Year 4: 1% growth Year 5: 0% growth Year 6: -1% growth Year 7: -1.5% growth Year 8: -2% growth Year 9: -3% growth Year 10: -5% growth The farm is willing to use $60,000 in cash towards purchasing additional animals. Other details you will need to consider: Average cull price = $600 (use this value to sell the animal after year 5; use the "book value" for years 1-5) Depreciation per head = $312.50 (assume we will only depreciate up to year 5) Use 1.5% for COGS and OE growth rate Manok Pro Option: 1. Use up to $60,000 cash to buy as many animals as you can @ $3000 per animal. 2. Use a combination of $60,000 cash and a loan (need to calculate what that is) with an APR of 4.50% to buy 50 animals. 3. For each scenario above, try it with and without depreciation as an expense, but keep the asset value for sale the same. Make note of the NPV-E, IRR, and monthly loan payments, different interest rates and costs for each scenario