Answered step by step
Verified Expert Solution
Question
1 Approved Answer
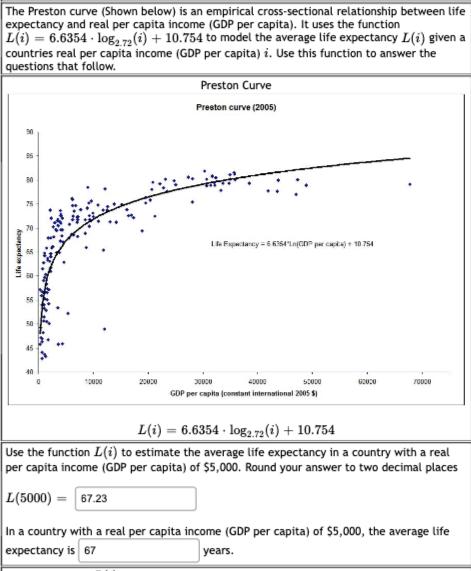
Life expectancy The Preston curve (Shown below) is an empirical cross-sectional relationship between life expectancy and real per capita income (GDP per capita). It

Life expectancy The Preston curve (Shown below) is an empirical cross-sectional relationship between life expectancy and real per capita income (GDP per capita). It uses the function L(i) 6.6354 log2.72 (1) + 10.754 to model the average life expectancy L(i) given a countries real per capita income (GDP per capita) i. Use this function to answer the questions that follow. Preston Curve g 95 10000 20000 30000 Preston curve (2005) Fancy-66354LCD pack) + 10.754 40000 GDP per capita (constant international 2005 $1 50000 60000 10000 L(i) = 6.6354 log2.72 (1) + 10.754 Use the function L(i) to estimate the average life expectancy in a country with a real per capita income (GDP per capita) of $5,000. Round your answer to two decimal places L(5000) 67.23 In a country with a real per capita income (GDP per capita) of $5,000, the average life expectancy is 67 years.
Step by Step Solution
There are 3 Steps involved in it
Step: 1

Get Instant Access to Expert-Tailored Solutions
See step-by-step solutions with expert insights and AI powered tools for academic success
Step: 2

Step: 3

Ace Your Homework with AI
Get the answers you need in no time with our AI-driven, step-by-step assistance
Get Started


