

Question
linear regression least square x = 0~99 y = 3.94415, 3.97807, 4.09693, 4.11904, 4.06317, 4.05686, 4.06638, 4.03058, 4.04649, 4.14835, 4.17254, 4.11442, 4.10624, 4.11801, 4.16598, 4.24282,
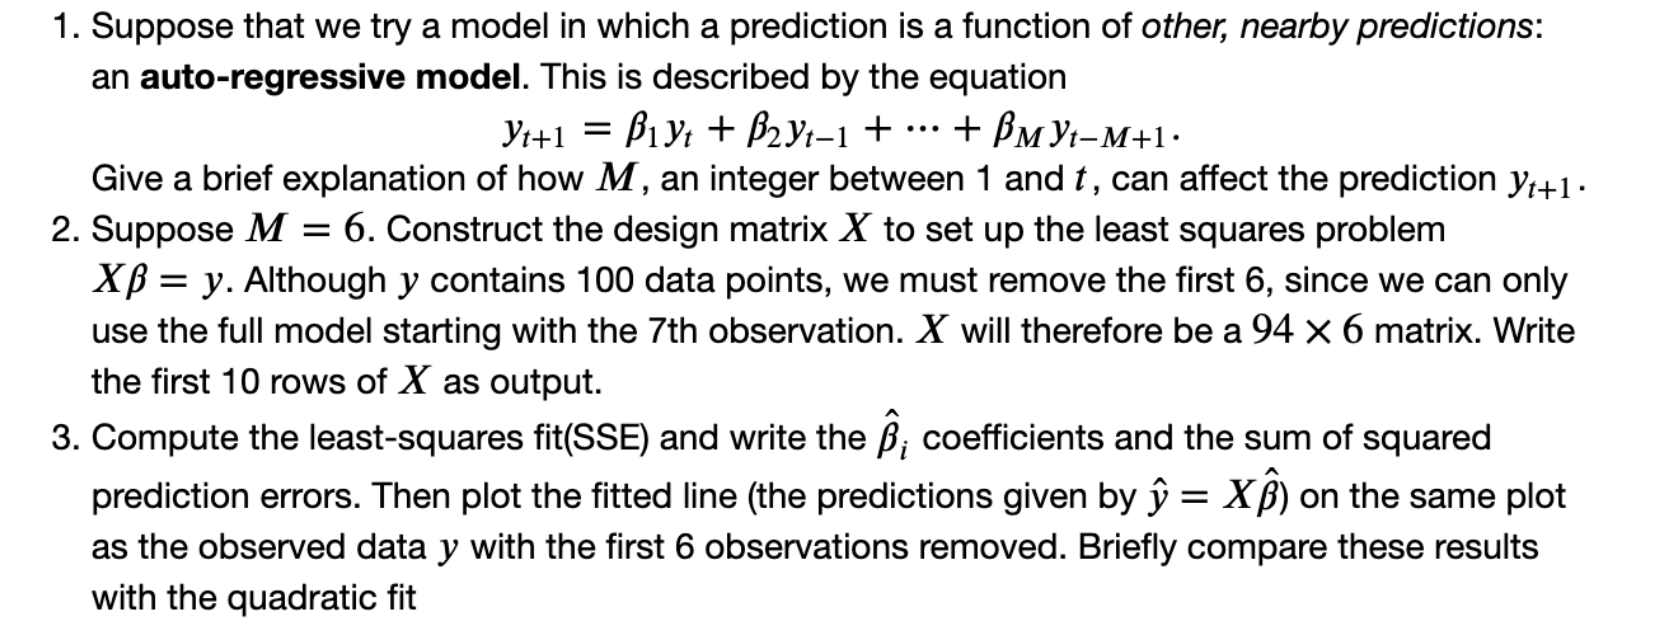
linear regression
least square
x = 0~99
y = 3.94415, 3.97807, 4.09693, 4.11904, 4.06317, 4.05686, 4.06638, 4.03058, 4.04649, 4.14835, 4.17254, 4.11442, 4.10624, 4.11801, 4.16598, 4.24282, 4.31614, 4.39529, 4.50085, 4.58523, 4.51913, 4.35429, 4.26464, 4.19857, 4.24936, 4.26235, 4.15231, 4.24887, 4.21525, 4.22308, 4.28567, 3.97022, 3.98685, 3.88015, 3.83922, 3.95643, 3.80209, 3.93445, 4.12188, 4.3648 , 4.38327, 4.11498, 4.0761 , 4.10511, 4.2115 , 4.50887, 4.51976, 4.53526, 4.5388 , 4.6059 , 4.66029, 4.46463, 4.50085, 4.38035, 4.292 , 4.25471, 4.03751, 3.93639, 3.79493, 3.64127, 3.62113, 3.4926 , 3.56318, 3.48388, 2.65713, 2.68076, 2.63914, 2.64936, 2.32367, 2.14232, 2.04312, 1.94932, 1.86427, 1.73696, 1.68449, 1.62008, 1.47107, 1.45533, 1.40012, 1.37119, 1.30851, 1.21287, 1.16142, 1.07481, 0.98572, 0.91472, 0.81421, 0.71291, 0.64062, 0.538 , 0.43556, 0.34499, 0.28139, 0.21698, 0.16944, 0.12972, 0.09522, 0.06814, 0.0459 , 0.03227

Step by Step Solution
There are 3 Steps involved in it
Step: 1

Get Instant Access to Expert-Tailored Solutions
See step-by-step solutions with expert insights and AI powered tools for academic success
Step: 2

Step: 3
Ace Your Homework with AI
Get the answers you need in no time with our AI-driven, step-by-step assistance
Get Started
Mathematical Logic Foundations For Information Science
Authors: Wei Li
2nd Edition
3034808623, 9783034808620