Link to Data required for questions:
https://1drv.ms/x/s!AmBKsnf4PUSthDxXcCZPk_X1XCFE?e=DqizQE
I need help with this question, struggling with part d of Question 1 and not sure about my following answers for Question 2. Want to see if what I have done for the other parts are correct.
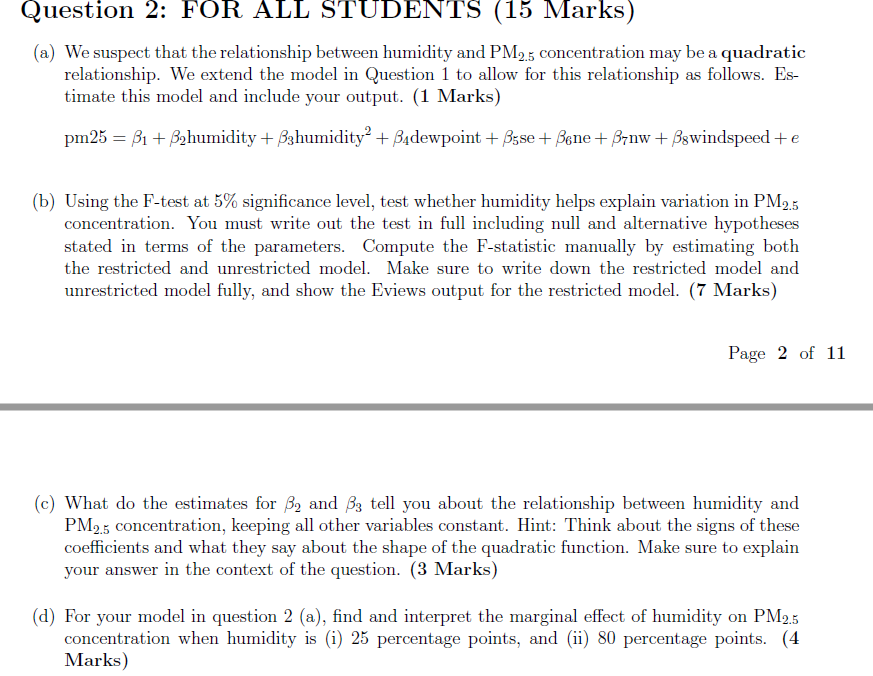
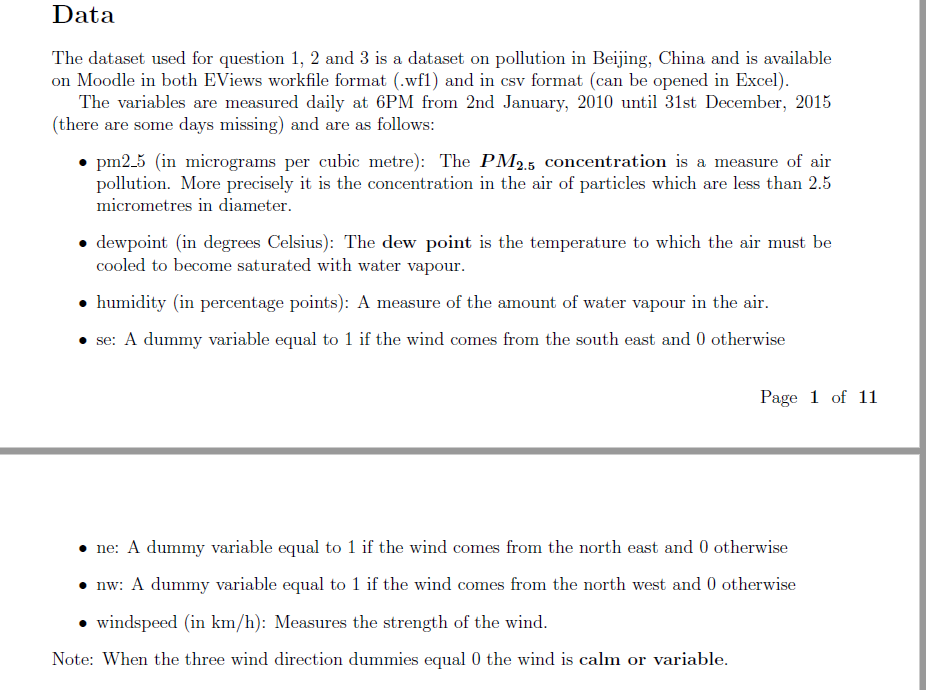
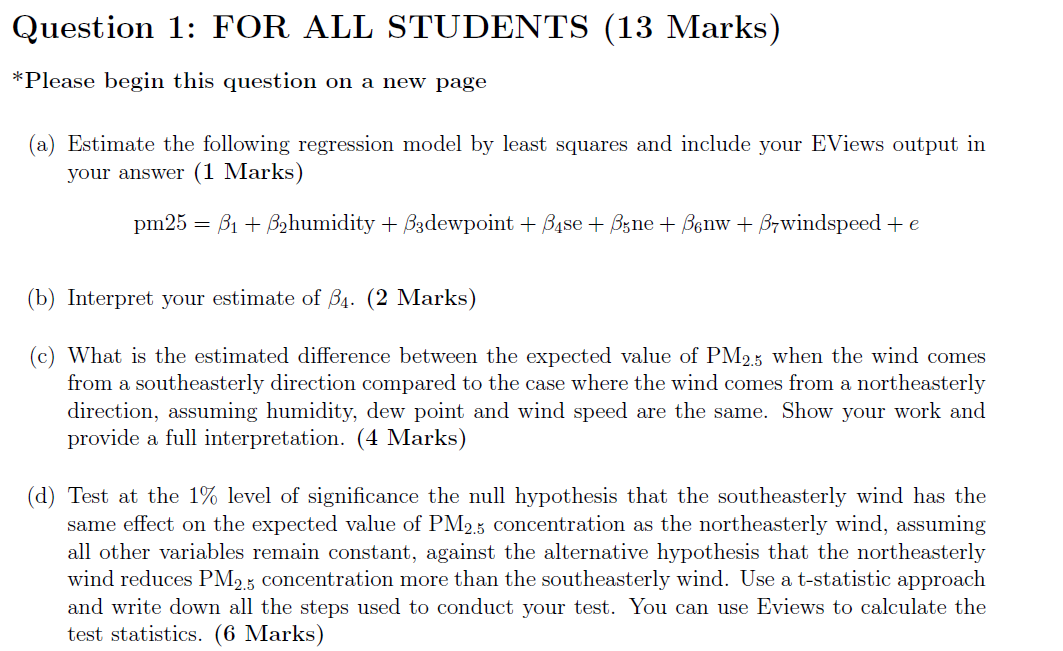
Question 2: FOR ALL STUDENTS (15 Marks) (a) We suspect that the relationship between humidity and PMglg concentration may he a quadratic relationship. We extend the model in Question 1 to allow for this relationship as follows. Es timate this model and include your output. [1 Marks) pm25 = '81 + ghumidity + ghumidity2 + ddewpoint + gse + gne + ,87nw + gwindspeed + e [b] Using the Ftest at 5% signicance levelJ test whether humidity helps explain variation in PMng concentration. You must write out the test in full including null and alternative hypotheses stated in terms of the parameters. Compute the Fstatistic manually by estimating both the restricted and unrestricted model. Make sure to write down the restricted model and unrestricted model fully1 and show the Eviews output for the restricted model. (7 Marks] Page 2 of 11 (c] What do the estimates for g and g tell you about the relationship between humidity and Phil-2'5 concentration, keeping all other variables constant. Hint: Think about the signs of these coeicients and what they say about the shape of the quadratic function. Make sure to explain your answer in the context of the question. (3 Marks) (d) For your model in question 2 (a)? nd and interpret the marginal emect of humidity on IBM-2'5 concentration when humidity is (i) 25 percentage points, and (ii) 80 percentage points. (4 Marks} Data The dataset used for question 11 2 and 3 is a dataset on pollution in Beijing, China and is available on Moodle in both EViews workle format (.wfl} and in csv format (can be opened in Excel]. The variables are measured daily at 5PM from 2nd January1 2010' until 31st December, 2015 (there are some days missing} and are as follows: 0 pm2_5 (in micrograms per cubic metre): The PM2_5 concentration is a measure of air pollution. More precisely it is the concentration in the air of particles which are less than 2.5 micrometres in diameter. 0 dewpoint {in degrees lCelsius): The dew point is the temperature to which the air must be cooled to become saturated with water vapour. o humidity [in percentage points): A measure of the amount of water vapour in the air. 0 se: A dummy variable equal to 1 if the wind comes from the south east and 0 otherwise Page 1 of 11 o ne: A durum},r variable equal to 1 if the wind comes from the north east and 0 otherwise 0 nw: A dummy variable equal to 1 if the wind comes from the north west and D otherwise 0 windspeed [in km f h): Measures the strength of the wind. Note: When the three wind direction dummies equal 0 the wind is calm or variable. Question 1: FOR ALL STUDENTS (13 Marks) *Please begin this question on a new page (a) (b) (d) Estimate the following regression model by least squares and include your EViews output in your answer (1 Marks) pm25 = 61 + ghumidity + gdewpoint + Elise + 35ne + snw + J87windspeed + e Interpret your estimate of )34. (2 Marks) What is the estimated dierence between the expected value of PMM when the wind comes from a southeasterly direction compared to the case where the wind comes from a northeasterly direction, assuming humidity, dew point and wind speed are the same. Show your work and provide a fuil interpretation. (4 Marks) Test at the 1% level of signicance the null hypothesis that the southeasterly wind has the same effect on the expected value of PM2_5 concentration as the northeasterly wind, assuming all other variables remain constant, against the alternative hypothesis that the northeasterly wind reduces PM2_5 concentration more than the southeasterly wind. Use a trstatistic approach and write down all the steps used to conduct your test. You can use Eviews to calculate the test statistics. (6 Marks)