

Answered step by step
Verified Expert Solution
Question
1 Approved Answer
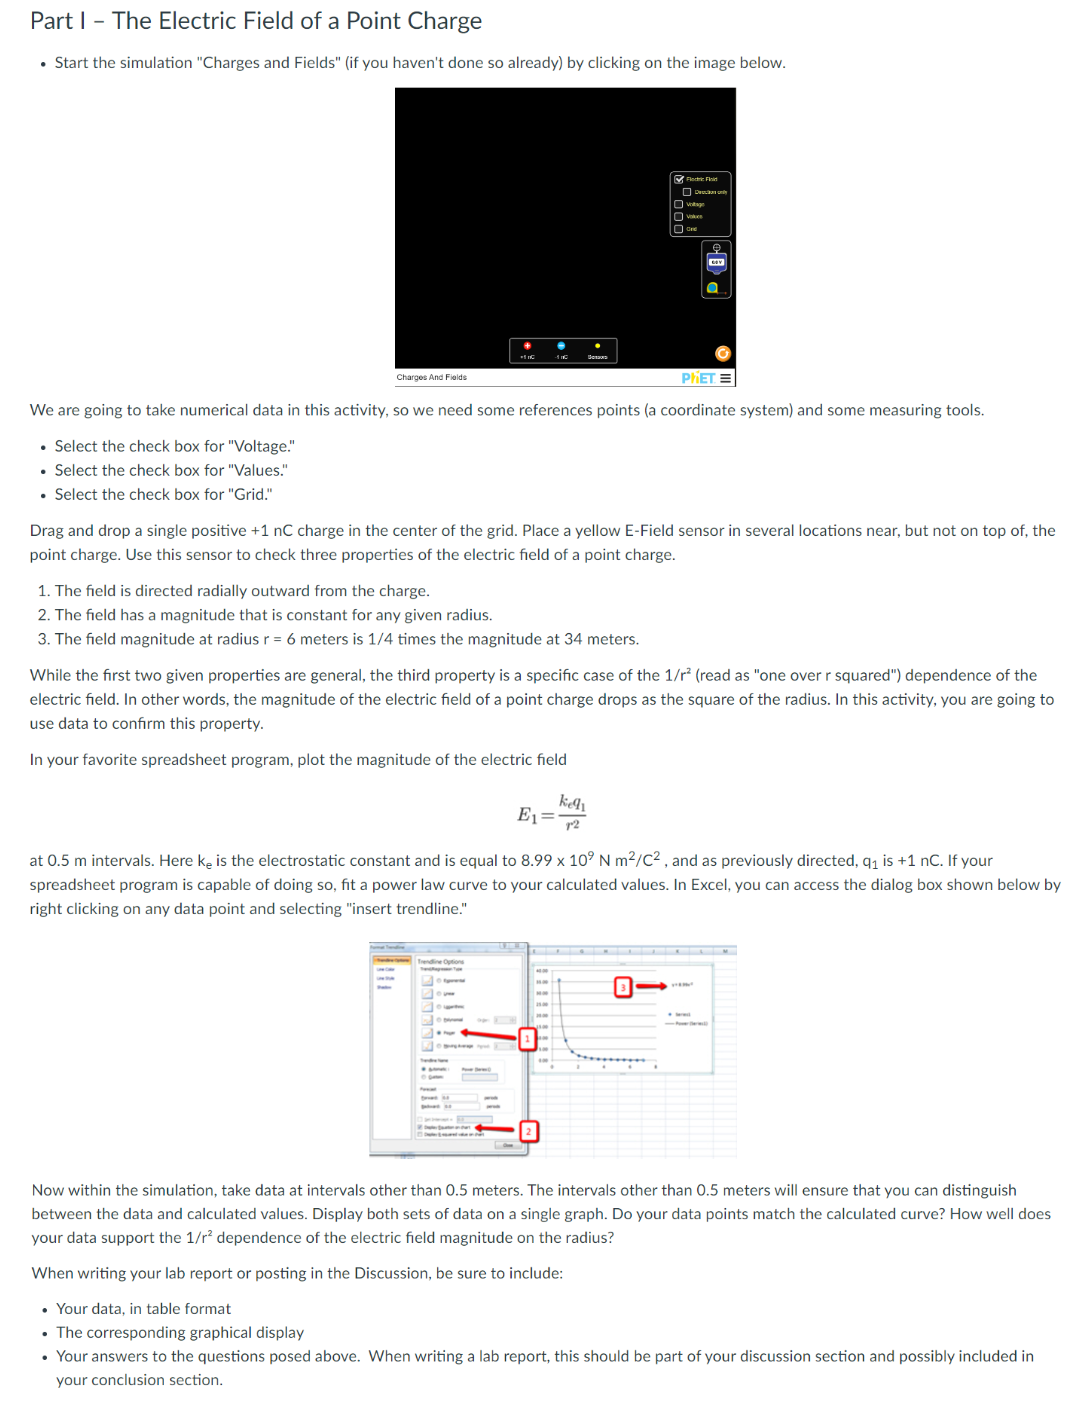
LINK TO SIMULATION IS HERE: https://phet.colorado.edu/sims/html/charges-and-fields/latest/charges-and-fields_en.html Part | - The Electric Field of a Point Charge Start the simulation Charges and Fields (if you haven't
LINK TO SIMULATION IS HERE: https://phet.colorado.edu/sims/html/charges-and-fields/latest/charges-and-fields_en.html
Step by Step Solution
There are 3 Steps involved in it
Step: 1

Get Instant Access to Expert-Tailored Solutions
See step-by-step solutions with expert insights and AI powered tools for academic success
Step: 2

Step: 3
Ace Your Homework with AI
Get the answers you need in no time with our AI-driven, step-by-step assistance
Get Started
Physics And The Ultimate Significance Of Time
Authors: David R. Griffin
1st Edition
088706115X, 9780887061158