Links- https://tinyurl.com/mth322data Desmos - You may use this Desmos calculator to create your charts. You can also create the charts by hand (see Digital Materials
Links- https://tinyurl.com/mth322data
Desmos - You may use this Desmos calculator to create your charts. You can also create the charts by hand (see Digital Materials for templates) or use a different graphing tool.
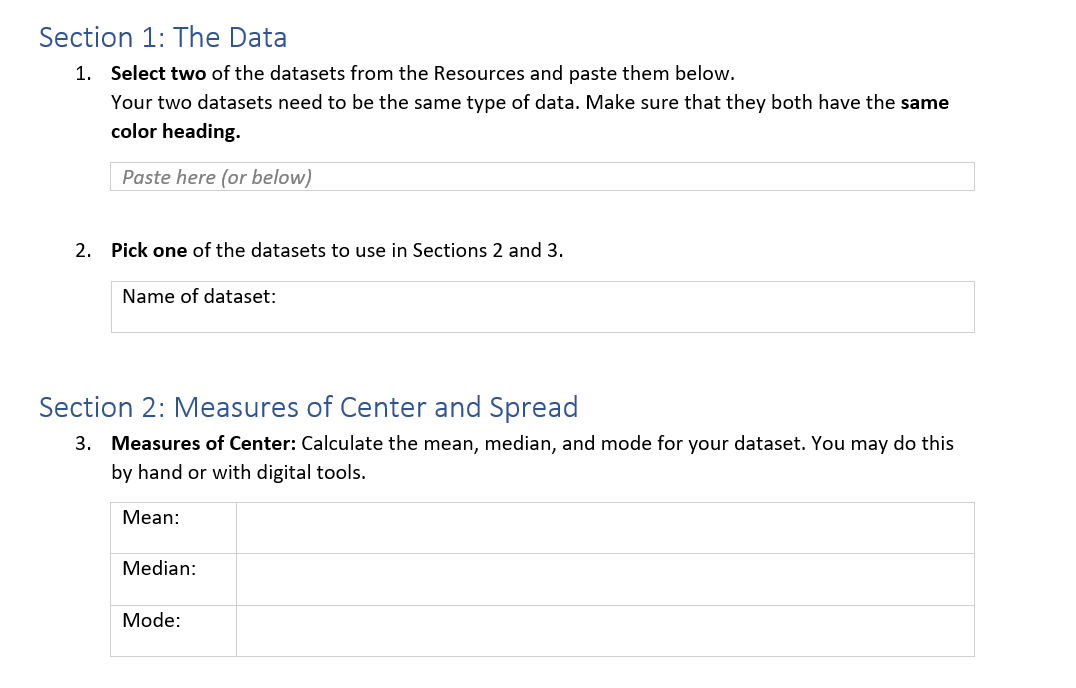
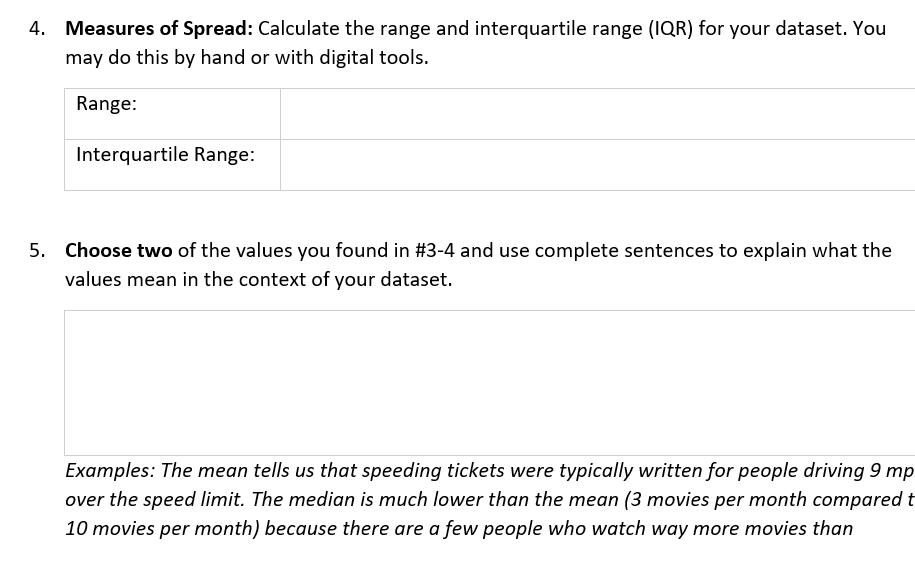
Graded Assignment: Interpreting Data MTH 322A | Math Foundations: Data, S.|D.A.1 and 2 In this assignment you will pick two datasets to analyze and interpret. The Sections of the assignment will take you though the steps of the analysis. The goal of the assignment is for you to share your interpretations and use mathematical language and reasoning. RESOURCES Datasets For this assignment you will select datasets from this document. Link address: https://tinyurl.com/mth322data Desmos You may use this Desmos calculator to create your charts. You can also create the charts by hand (see Digital Materials for templates} or use a different graphing tool. Link address: https:/ftinyur|.com/mth322p|ots N OTE For full credit you must show your thinkingr your reasoning, and your work. You mayr use calculators, but you should show your thinking by including what you put into the calculator, not just the result. Section 1: The Data 1. Select two of the datasets from the Resources and paste them below. Your two datasets need to be the same type of data. Make sure that they both have the same color heading. Paste here (or beiow) 2. Pick one ofthe datasets to use in Sections 2 and 3. Name of dataset: Section 2: Measures of Center and Spread 3. Measures of Center: Calculate the mean, media In and mode for your dataset. You may do this by hand or with digital tools. Mean: Median: Mode: Measures of Spread: Calculate the range and interquartile range (IQR) for your dataset. You may do this by hand or with digital tools. Range: Interquartile Range: Choose two of the values you found in #3-4 and use complete sentences to explain what the values mean in the context of your dataset. Examples: The mean tells us that speeding tickets were typically written for people driving 9 mp over the speed limit. The median is much lower than the mean (3 movies per month compared t 10 movies per month) because there are afew people who watch way more movies than 4. Measures of Spread: Calculate the range and interquartile range (IQR) for your dataset. You may do this by hand or with digital tools. Range: Interquartile Range: 5. Choose two of the values you found in #3-4 and use complete sentences to explain what the values mean in the context of your dataset. Examples: The mean tells us that speeding tickets were typically written for people driving 9 mph over the speed limit. The median is much lower than the mean (3 movies per month compared to 10 movies per month) because there are afew people who watch way more movies than 4. Measures of Spread: Calculate the range and interquartile range (IQR) for your dataset. You may do this by hand or with digital tools. Range: Interquartile Range: 5. Choose two of the values you found in #3-4 and use complete sentences to explain what the values mean in the context of your dataset. Examples: The mean tells us that speeding tickets were typically written for people driving 9 mph over the speed limit. The median is much lower than the mean (3 movies per month compared to 10 movies per month) because there are a few people who watch way more movies than 2 [Your Name Here] everyone else. The interquartile range tells us that most people are willing to pay between $6 and $12 for nachos at a baseball game.6. Make a dot plot, a histogram, and a box plot for your data. You may use digital tools (see Resources) or draw them by hand. Include the charts below or attach another file. a. Dot Plot b. Histogram C. Box Plot 7. Pick one of the values that you calculated in #3-4 and explain how the value is connected to at least one of the charts. Describe how to find that value from the chart. Example: You can find the mode on the by _ 8. If you could only use one summary statistic (measures of center and spread) and one chart to communicate this data, which ones would you pick? Use complete sentences to justify your choices for the best representations of this data. Examples: The is the best measure of center because . I would pick the because on that chart it is easy to see Section 4: Comparisons 9. Now it is time to compare your two datasets. What similarities and differences do you see? You should discuss the shape, center, and spread of the data. Explain your reasoning and use mathematical evidence to support your claims. Include at least one chart and at least one summary statistic for the second dataset.10. Answer the question that matches your chosen datasets. Justify your answer with evidence from the data. {Ignore the other questions!) Datasets Heart Rates: compared both female groups or both male groups Heart Rates: compared a male and a female group Questions This data was collected from patients in a medical trial. Group 2 was taking a medicine to reduce their heart rates, and Group 1 was taking a placebo (a sugar pill}. Do you think this medicine is effective? This data was collected from a random sample of college students for the campus Health Clinic. Do you think there are significant differences in the typical heart rates of women and men on campus? Test Scores This data was collected from students who are taking the same class but have two different teachers. Would you rather have the teacher of Group 1 or the teacher of Group 2? Baseball Teams This data was collected from the 2019 Major League Baseball season. Ofthe two teams you compared, which team has better power hitters? Throwing Da rts This data was collected from one person. They threw darts at a target 25 times with each hand. Do you think this person is righthanded or left-handed? Interpreting Data: Chart Templates MTH 322A I Math Foundations: Data, S.|D.A.1 and 2 You may use these templates if you wish to draw your charts by hand, on printed paper or witl tools. You can print this document, copy the images into editingfdrawing software, or another that works for you. Don't forget to add axis labels and chart titles.\" Interpreting Data: Chart Templates MTH 322A | Math Foundations: Data, S.ID.A.1 and 2 You may use these templates if you wish to draw your charts by hand, on printed paper or with digital tools. You can print this document, copy the images into editing/drawing software, or another option that works for you. Don't forget to add axis labels and chart titles!
Step by Step Solution
There are 3 Steps involved in it
Step: 1
Get Instant Access to Expert-Tailored Solutions
See step-by-step solutions with expert insights and AI powered tools for academic success
Step: 2
Step: 3
Ace Your Homework with AI
Get the answers you need in no time with our AI-driven, step-by-step assistance